Monitoring Points
Monitoring Point List
Screen Overview
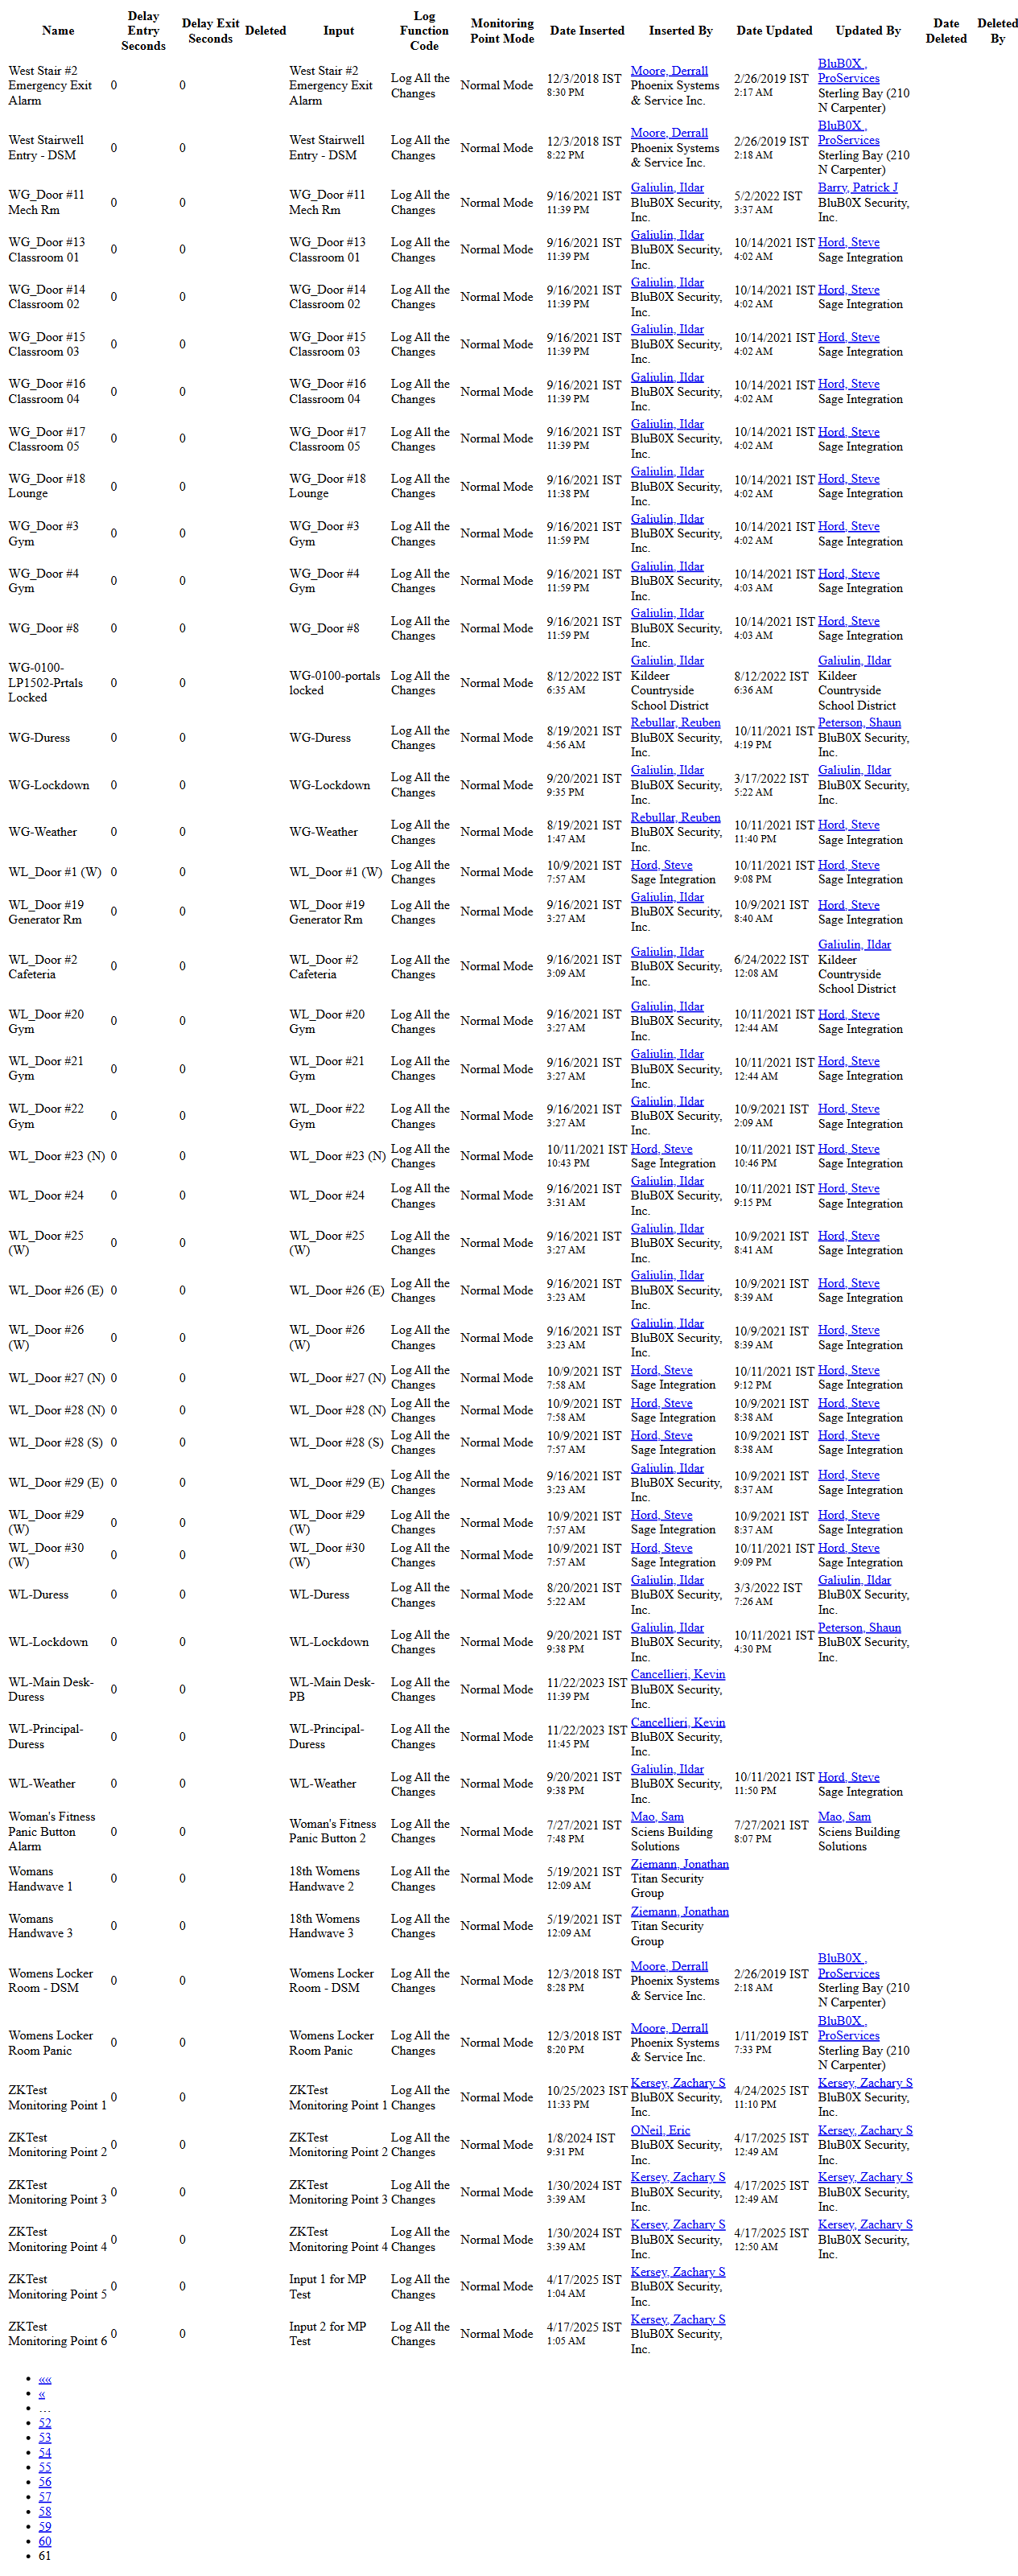
The Monitoring Point List screen provides a centralized view to search, filter, review, and manage all monitoring points configured in BluSKY. Administrators can narrow results by System, Controller, and SIO Board, perform keyword searches, and view operational/audit details for each point. Context actions allow creating, viewing, editing, deleting, and opening an expanded report view of monitoring points.
Field Definitions
| Field Label | Definition | Notes |
|---|---|---|
| System | Filter to monitoring points that belong to a specific system/site. | Optional filter; improves performance on large datasets. |
| Controller | Filter to points on a specific controller within the selected system. | Disabled until a System is chosen in some deployments. |
| SIO Board | Filter to points on a specific SIO/IO board. | Further narrows the list to a board-level view. |
| Search Text | Keyword search against monitoring point Name. | Partial matches supported; case-insensitive. |
| View | Status filter for records. | Default shown is “All Active.” Other options may include All or Deleted (varies by configuration). |
| Submit | Executes the current filters and refreshes the grid. | Also clears any existing row selections. |
| Reset | Clears all filters back to their defaults. | Restores default View and empties Search Text. |
| Monitoring Point Count | Total number of records returned by the current filter set. | Updates after each Submit. |
| Selection Counter | Displays the number of selected rows, e.g., “(1/50 selected)”. | Maximum multi-select capacity displayed (e.g., up to 50). |
| Name | The configured name/label of the monitoring point. | Click to select the row; unique naming recommended. |
| Delay Entry Seconds | Number of seconds the system waits after an entry event before acting. | Integer; 0 means no entry delay. |
| Delay Exit Seconds | Number of seconds the system waits after an exit event before acting. | Integer; 0 means no exit delay. |
| Deleted | Indicates whether the point is soft-deleted. | Typically 0 = Active; visible values depend on View filter. |
| Input | The physical/logical input associated with the monitoring point. | Shows the bound device or source (e.g., door contact, DPS). |
| Log Function Code | The logging rule applied to the point (e.g., “Log All the Changes”). | Determines what events are recorded for this point. |
| Monitoring Point Mode | Current operating mode of the point (e.g., Normal Mode). | Visible in the expanded report view. |
| Date Inserted | Timestamp when the monitoring point was created. | Read-only; shown in expanded view. |
| Inserted By | User who created the record. | Read-only; shown in expanded view. |
| Date Updated | Timestamp of the most recent update. | Read-only; shown in expanded view. |
| Updated By | User who performed the most recent update. | Read-only; shown in expanded view. |
| Date Deleted | Timestamp when the record was deleted (if applicable). | Read-only; only populated for deleted records; expanded view. |
| Deleted By | User who deleted the record (if applicable). | Read-only; expanded view only. |
Screen Actions and Functions
- Create – Opens a form to add a new monitoring point.
- View – Opens the selected monitoring point in read-only mode.
- Edit – Allows modification of the selected monitoring point’s details.
- Delete – Soft-deletes the selected monitoring point; the record remains available for audit and can be viewed via the View filter.
- Expand – Opens an expanded, paginated report view that includes additional audit columns (e.g., Inserted/Updated information) suitable for printing.
- Row Select – Select one or multiple rows (up to the displayed limit) to enable View, Edit, and Delete.
- Submit – Applies filters and refreshes results.
- Reset – Clears filters and restores defaults.
Usage Instructions & Examples
How to find monitoring points on a specific controller
- Choose a System.
- Select the Controller and, optionally, an SIO Board.
- Optionally enter a keyword in Search Text.
- Click Submit to refresh the list.
How to view details for a monitoring point
- Locate and select a row in the grid.
- Click View to open the read-only record.
How to edit delay timers for a monitoring point
- Select the monitoring point in the grid.
- Click Edit.
- Update Delay Entry Seconds and/or Delay Exit Seconds.
- Save your changes; verify the grid reflects the new values.
How to create a new monitoring point
- Click Create.
- Enter a Name, assign the appropriate Input, and set Log Function Code and delay values.
- Save. The point appears in the list and the Monitoring Point Count updates.
How to generate a printable list with audit columns
- Apply filters as needed and click Submit.
- Click Expand to open the expanded report view.
- Use the browser’s print controls to print or save as PDF.
System Behaviors and Edge Cases
- Actions (View/Edit/Delete) are disabled until at least one row is selected.
- The View filter controls record visibility. Deleted records are hidden unless the filter includes them.
- Submit clears any current selections and updates the Monitoring Point Count.
- Multi-select is limited to the value displayed in the Selection Counter (e.g., up to 50 records).
- Delay Entry/Exit Seconds accept whole numbers only; 0 indicates no delay.
- Expand opens a paginated report with additional read-only audit fields; page navigation is shown at the bottom.
- When very large datasets are returned, filtering by System/Controller/SIO Board significantly improves responsiveness.
Permissions
- Access typically granted to administrative roles responsible for setup and configuration (e.g., Global Administrators, Tenant/Facility Administrators).
- Edit and Create require modify privileges for monitoring points.
- Delete requires a dedicated delete permission; users without it will not see the Delete option.
- Read-only users can search and view but cannot create, edit, or delete.
Linked Workflows
- Monitoring points are associated to hardware Inputs and are used for event logging and alerting.
- Changes to monitoring points may affect alarm/notification workflows and reporting.
- After creating or editing a point, verify downstream rules, notifications, or dashboards that reference the point.
Reference Image Links