Input Output Diagnostics
Input-Output Diagnostics Screen
Screen Overview
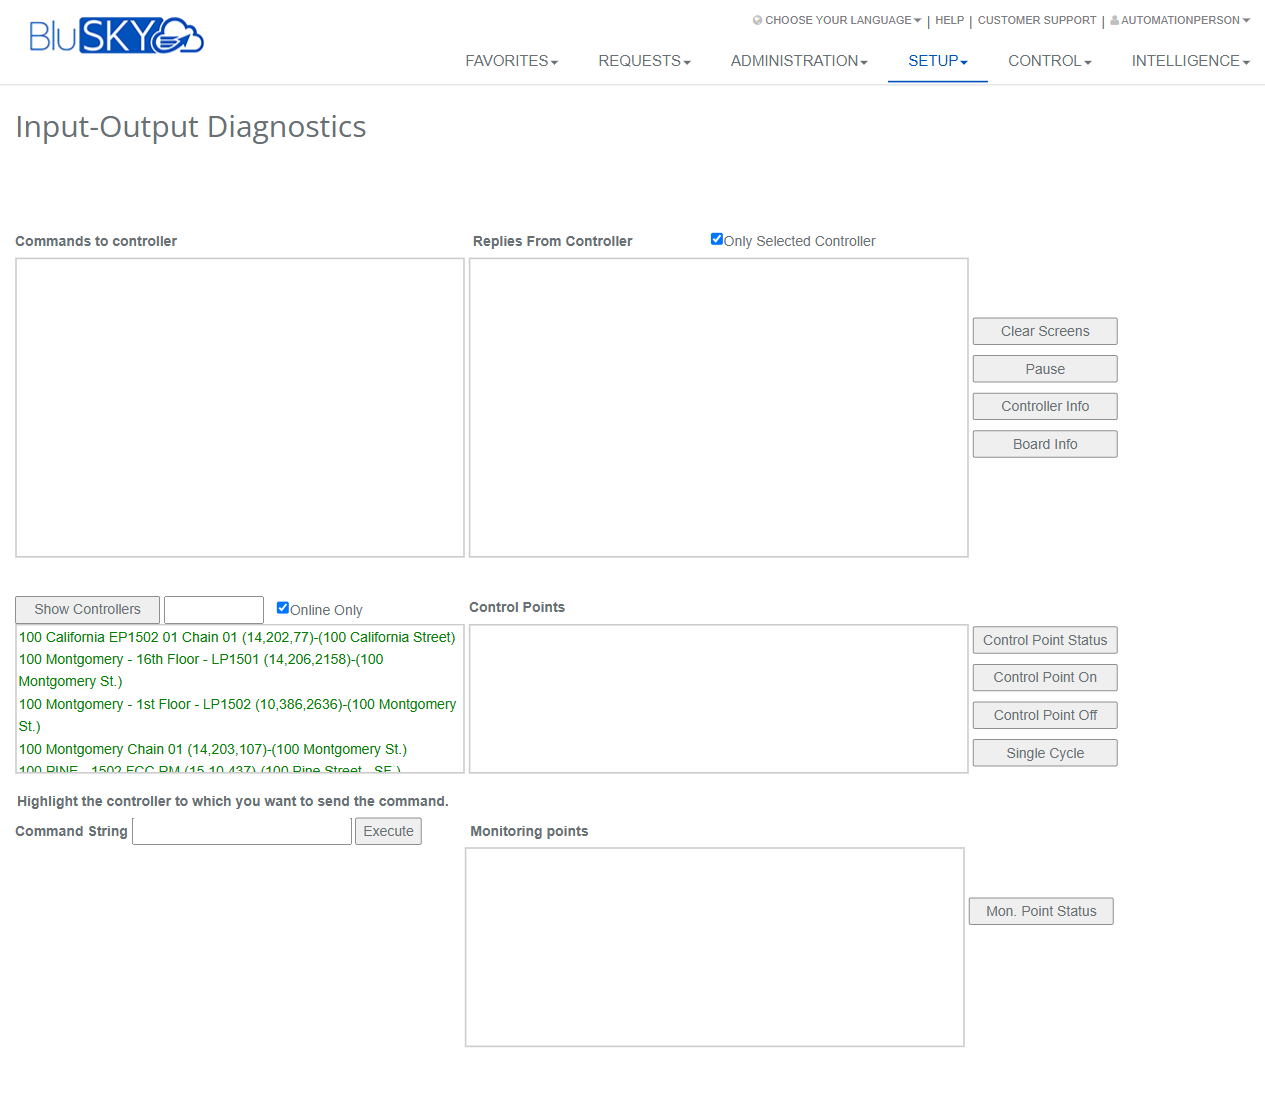
The Input-Output Diagnostics screen provides real-time tools to test, monitor, and troubleshoot controller communications, control points (outputs), and monitoring points (inputs). It shows command and reply logs, lets you select a controller, view its points, issue manual commands, and query device/board information directly from BluSKY.
Field Definitions
| Field Label | Definition | Notes |
|---|---|---|
| Commands to controller | Read-only log showing commands issued from BluSKY to the controller. | Auto-updates while active; can be cleared or paused. |
| Replies From Controller | Read-only log of responses returned by the controller. | Filtered by “Only Selected Controller” when enabled. |
| Only Selected Controller | Checkbox to limit the Replies log to the currently highlighted controller. | Uncheck to view replies from all controllers visible to your account. |
| Show Controllers | Button to load or refresh the controller list using the current filters. | Use after changing the filter/search fields. |
| Controller Filter | Text field to narrow the controller list by name/ID. | Partial matches allowed. Leave blank to show all (subject to Online Only). |
| Online Only | Checkbox to display only controllers that are currently online. | Enabled by default to reduce noise during diagnostics. |
| Controllers | List of available controllers. Select one to run diagnostics and load its points. | Highlight a controller before issuing most commands. |
| Control Points | Panel that lists output/control points for the selected controller. | Select one or more points before running point actions. |
| Command String | Free-form text field to send a raw command to the selected controller. | Advanced use; format must match controller protocol. |
| Execute | Button that sends the Command String to the highlighted controller. | Disabled or ineffective if no controller is selected. |
| Monitoring points | Panel that lists input/monitor points for the selected controller. | Read-only until a status query is performed. |
| Clear Screens | Button to clear both the Commands and Replies log panes. | Clears the UI logs only; does not delete audit history. |
| Pause | Button to temporarily stop appending new lines to the log panes. | Useful for reading static content; actions still run in background. |
| Controller Info | Button to query and display details about the selected controller. | Typical details include firmware, network, and health info. |
| Board Info | Button to query and display details about boards/modules on the selected controller. | Content varies by hardware model. |
| Control Point Status | Button to query and display the current state of selected control points. | Results appear in the Replies log and/or Control Points panel. |
| Control Point On | Button to command selected control points to turn ON. | Safety policies may restrict availability. |
| Control Point Off | Button to command selected control points to turn OFF. | Safety policies may restrict availability. |
| Single Cycle | Button to pulse selected control points (momentary ON then OFF). | Pulse duration is hardware/config dependent. |
| Mon. Point Status | Button to query and display the status of monitoring (input) points. | Results appear in the Monitoring points panel and/or Replies log. |
Screen Actions and Functions
- Load or refresh controllers using Show Controllers; filter by text and Online Only.
- Select a controller to populate Control Points and Monitoring points.
- Query device details with Controller Info and Board Info.
- Manage output states with Control Point Status, Control Point On, Control Point Off, and Single Cycle.
- Query inputs with Mon. Point Status.
- Issue advanced/manual commands via Command String + Execute.
- Manage visibility of logs using Pause and Clear Screens.
Usage Instructions & Examples
-
View live controller communications
- Ensure Online Only is checked (optional).
- Click Show Controllers.
- Highlight a controller.
- Observe Commands to controller and Replies From Controller as you run actions; use Pause to stop auto-scrolling when needed.
-
Turn a control point ON, verify status, then turn it OFF
- Highlight the target controller.
- In Control Points, select one or more points.
- Click Control Point On.
- Click Control Point Status to confirm the change in the Replies log.
- Click Control Point Off to revert the points.
-
Pulse a control point (Single Cycle)
- Highlight the controller and select the point.
- Click Single Cycle.
- Review the Replies log to confirm the pulse was issued.
-
Check monitoring (input) point states
- Highlight the controller.
- Click Mon. Point Status.
- Review Monitoring points and/or the Replies log for current states.
-
Send a raw command for advanced diagnostics
- Highlight the controller.
- Enter the required protocol command in Command String.
- Click Execute.
- Verify the response in Replies From Controller.
- Use Clear Screens to reset the panes if needed.
System Behaviors and Edge Cases
- If no controller is selected, point actions and Execute may be disabled or will return no results.
- Online Only hides offline controllers; uncheck to diagnose connectivity issues with offline units.
- Pause stops new lines from displaying but does not stop the underlying actions; new data will appear after unpausing.
- Clear Screens removes on-screen logs only; historical data remains in the system audit/event history.
- Some actions are hardware- or firmware-dependent; unavailable operations may return a “not supported” message in Replies.
- Single Cycle pulse duration is determined by controller configuration and may not be visible if the UI refresh lags.
- Raw commands in Command String must follow the controller’s protocol; malformed commands are rejected and logged.
- Large result sets may stream in batches; the log panes will grow until cleared or the session ends.
Permissions
- Access typically limited to Global Administrators, Integrators, and Tenant Administrators with controller maintenance rights.
- Executing output actions (On/Off/Single Cycle) requires elevated permissions specific to device control.
- Viewing controller/board info may be allowed to read-only diagnostic roles; write/control actions are restricted.
- All actions are subject to site-level safety policies and are audited.
Linked Workflows
- Device/Controller setup and provisioning (controller creation, network settings).
- Control Points and Monitoring Points configuration screens.
- Event/Alarm History for reviewing outcomes of diagnostic actions.
- Health and Status dashboards for continuous device monitoring.
Reference Image Links