Sept 2025 - 3
BluSKY Web 18th September Release Notes
Interactive Maps Enhancements
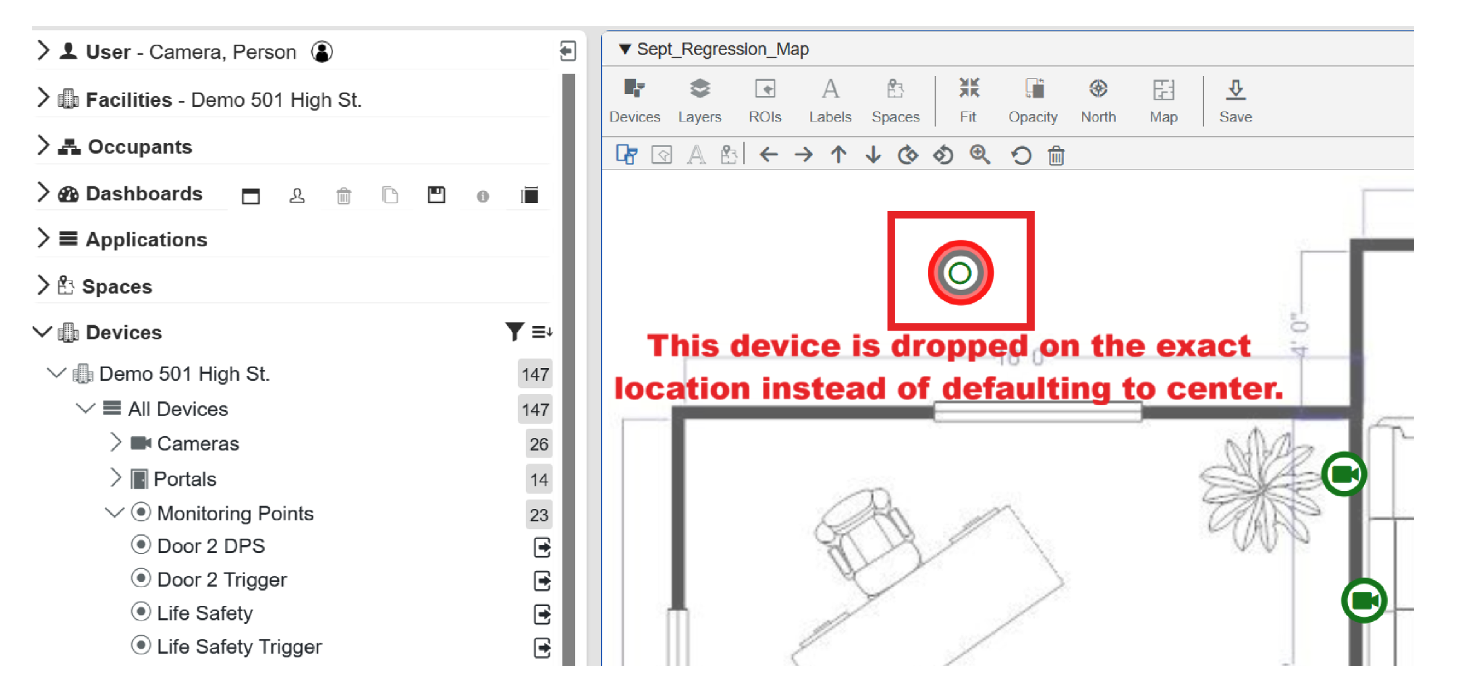
Accurate Device Placement:
- Devices dropped onto the Interactive Maps page are now placed at their exact drag-and-drop location, instead of defaulting to the map center, allowing for precise placement.
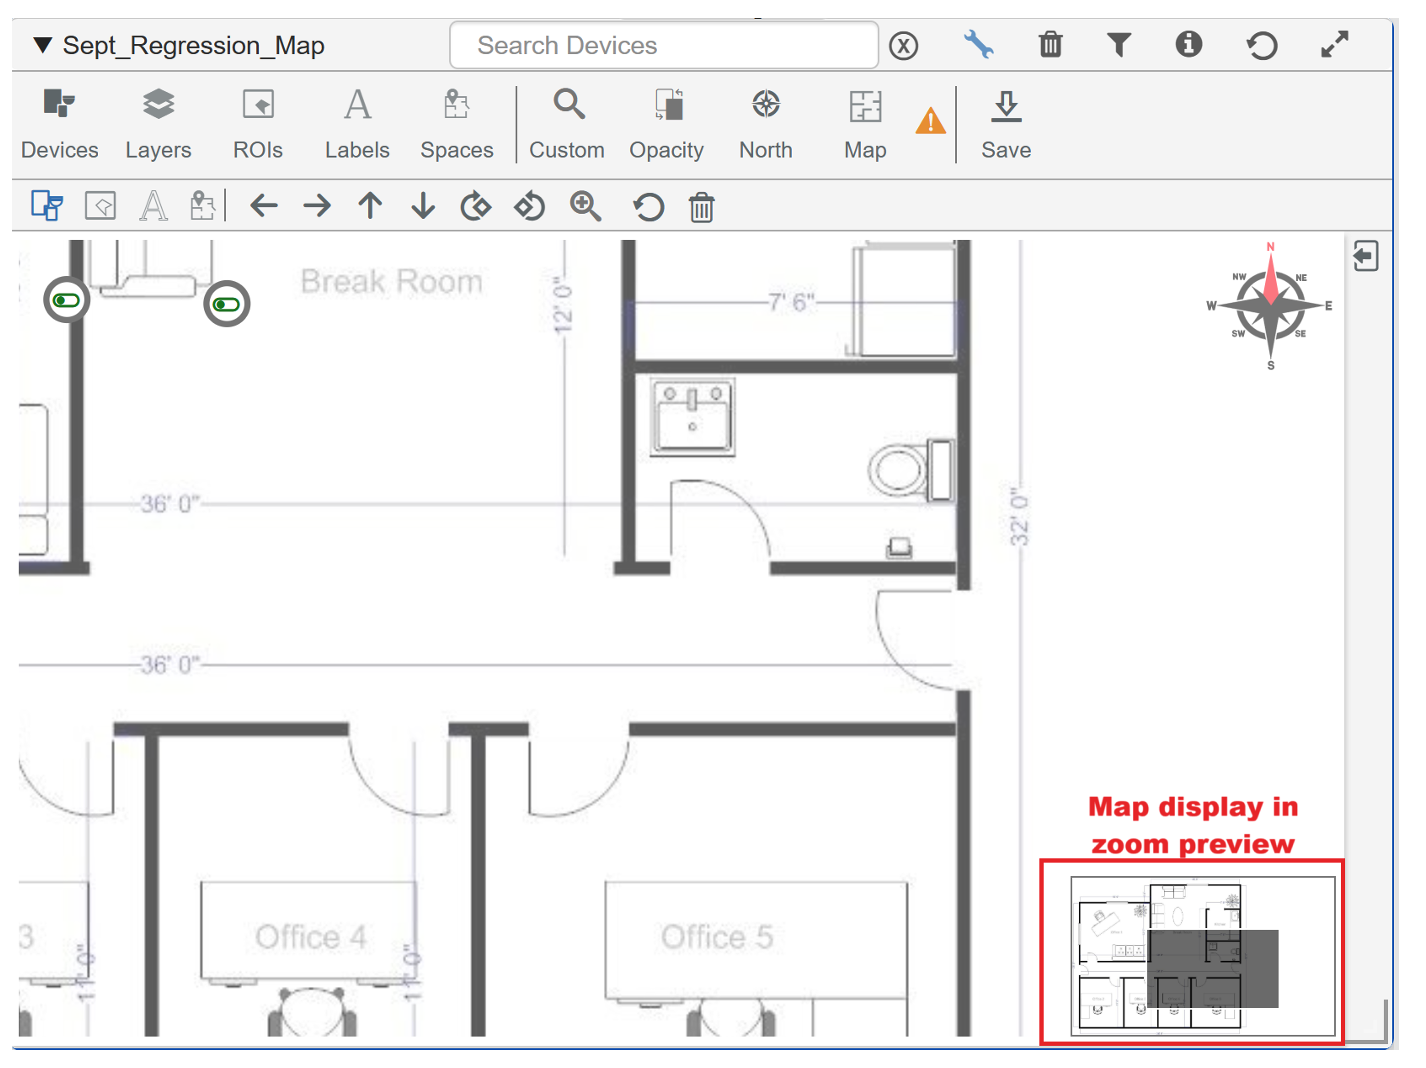
Zoom Preview with Map Display:
- Added a map display in the Zoom Preview, enabling users to examine maps in greater detail for improved navigation and more accurate device positioning.
![]()
Video Player Enhancements
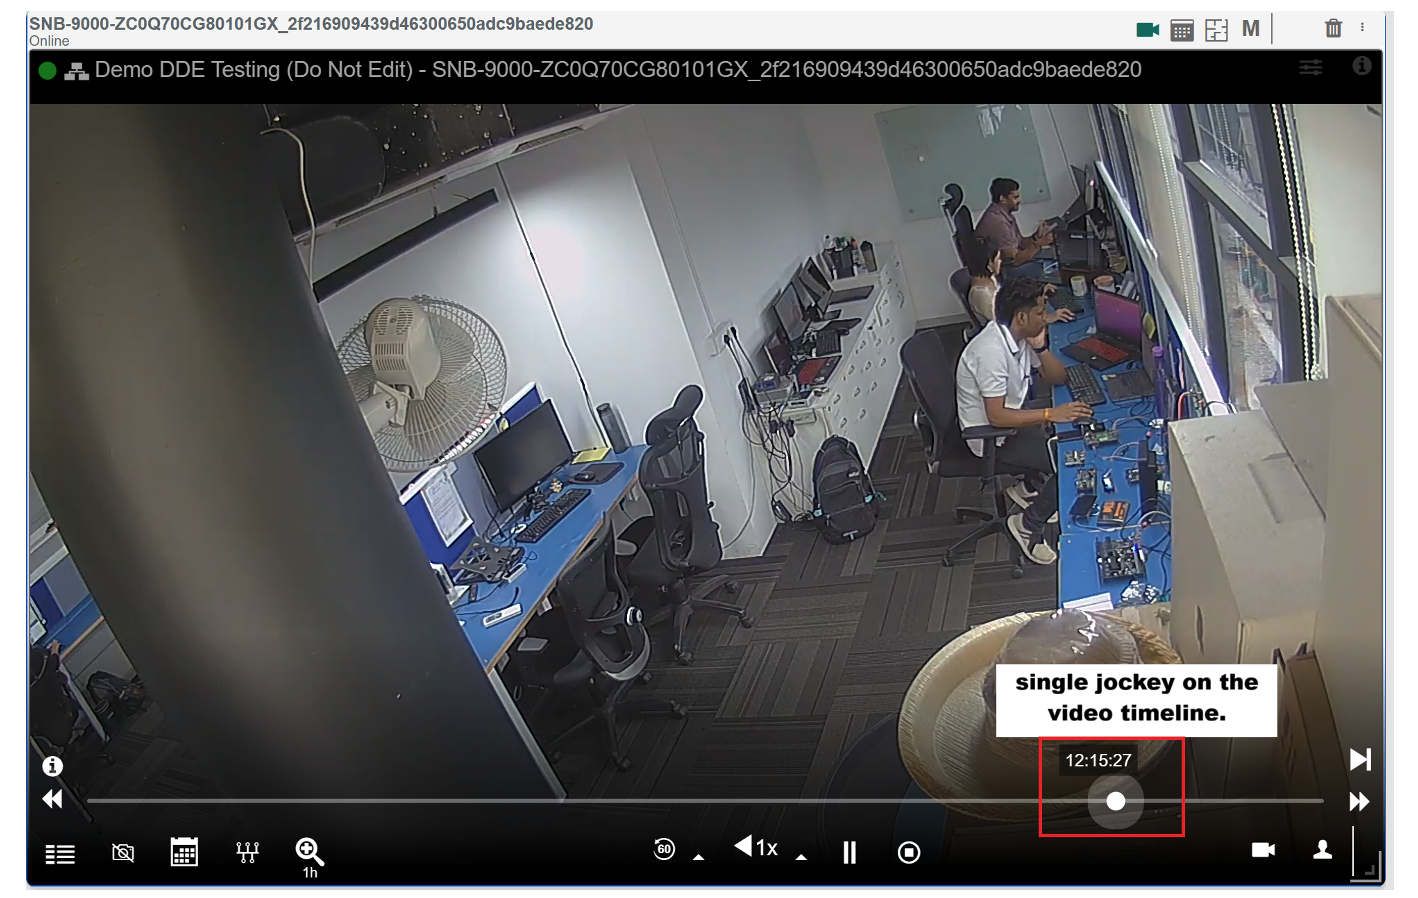
BluB0X 2025 NVR (AVMS) Camera Support:
- For BluB0X 2025 NVR (AVMS) cameras, the player now uses a single jockey on the video timeline. In playback mode, moving the jockey will jump the stream to the selected time.
Snapshot Placeholders:
The Video Player now displays the camera’s latest snapshot while loading live feeds.
- For playback streams, it shows the snapshot closest to the requested playback time (±30 seconds), providing users with quick visual feedback.
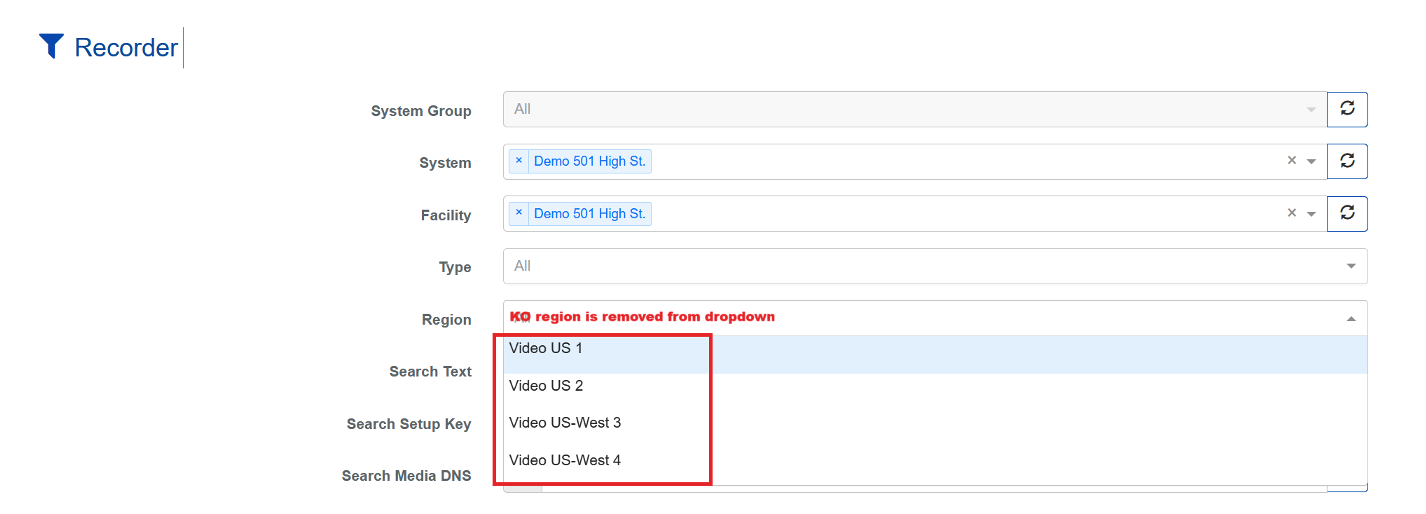
Recorder Video Region.
Video Region Dropdown Update:
- Removed the KO option from the Recorder’s Video Region dropdown to prevent its selection and ensure valid configuration options only.
- Removed outdated video regions from the dropdown.
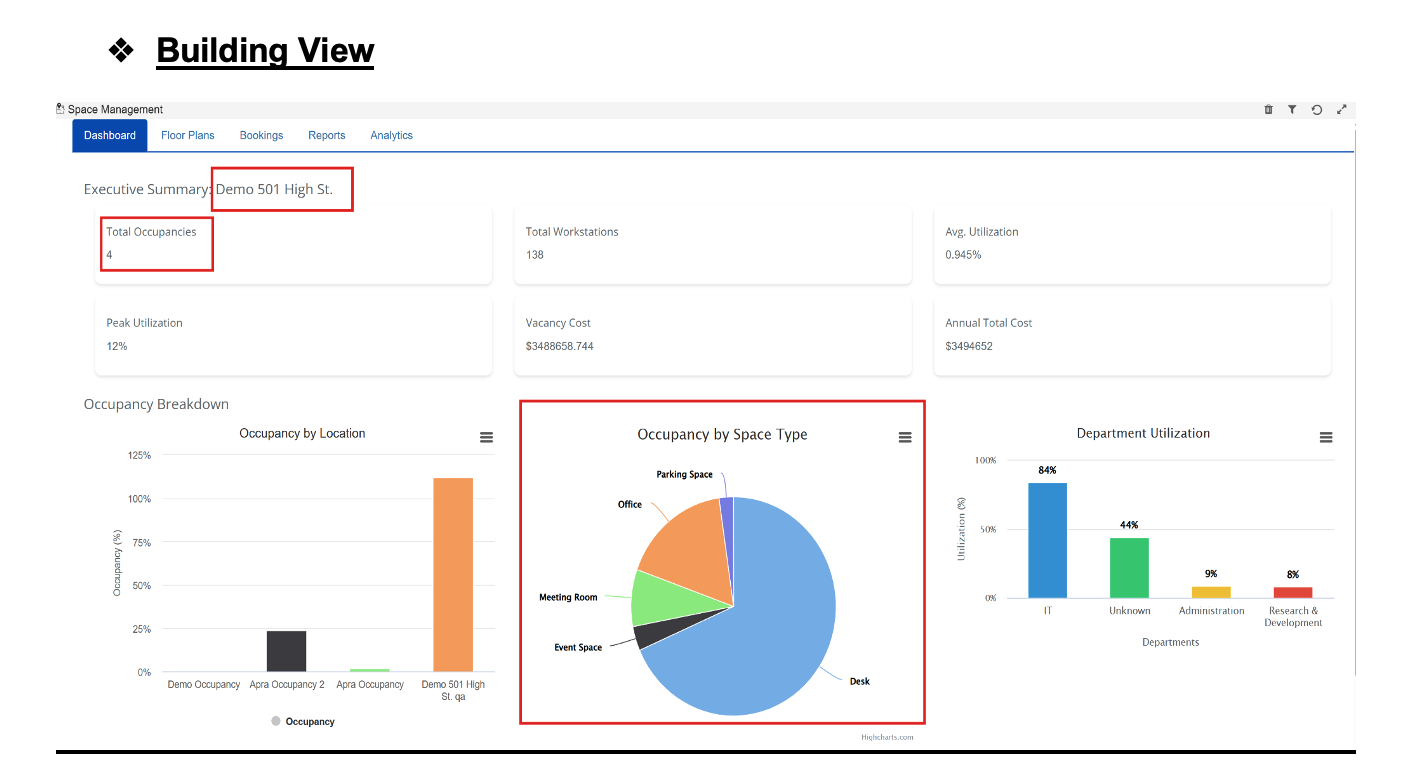
Space Management DashBoard
Space Management Dashboard update for Building / Occupancy view
- Accurate Building Data: Metrics now correctly reflect the selected building.
- Total Workstations & Occupancies: Automatically calculated from occupant data.
- Improved Utilization & Cost Metrics: Average/Peak Utilization and Annual Costs display correctly.
- Updated Charts: Occupancy Breakdown shows workstation counts per occupant.
Building View
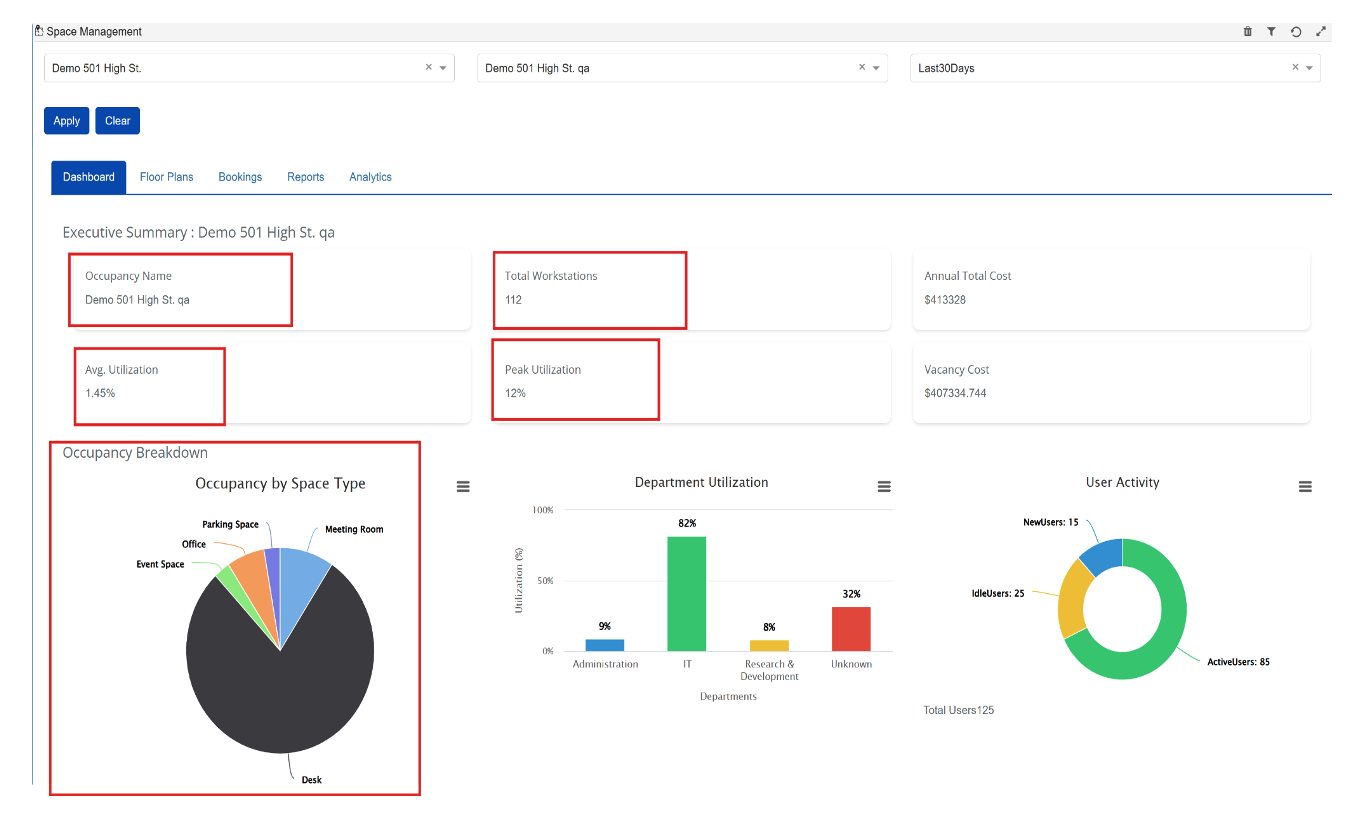
Occupancy view
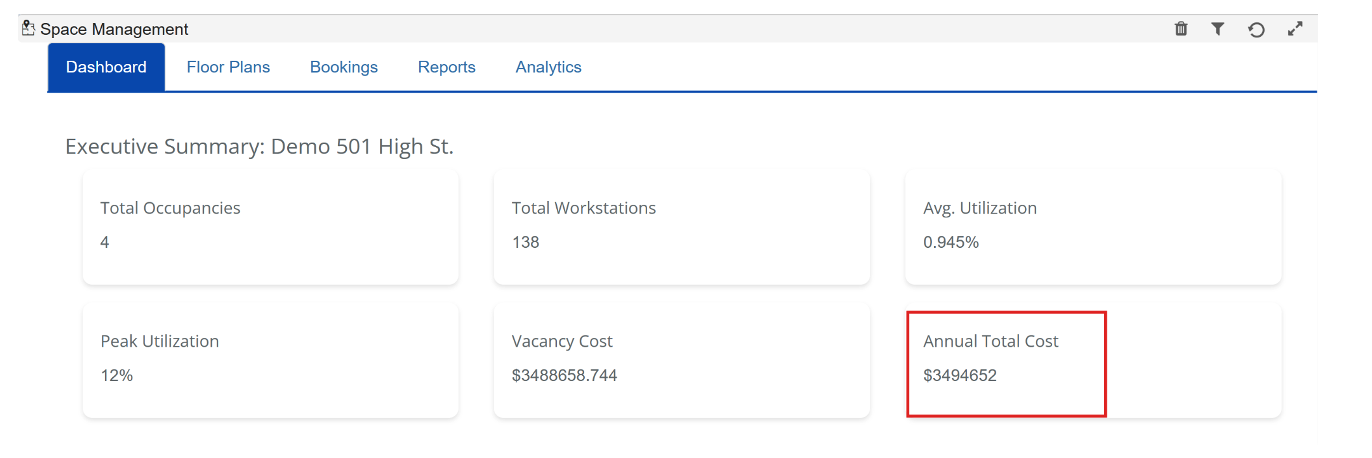
Display Total Lease cost on Dashboard.
- The dashboard now displays the annual lease cost for a facility.
- Calculated by summing the lease cost of all occupancies within the facility and multiplying by 12 for an annualized value.
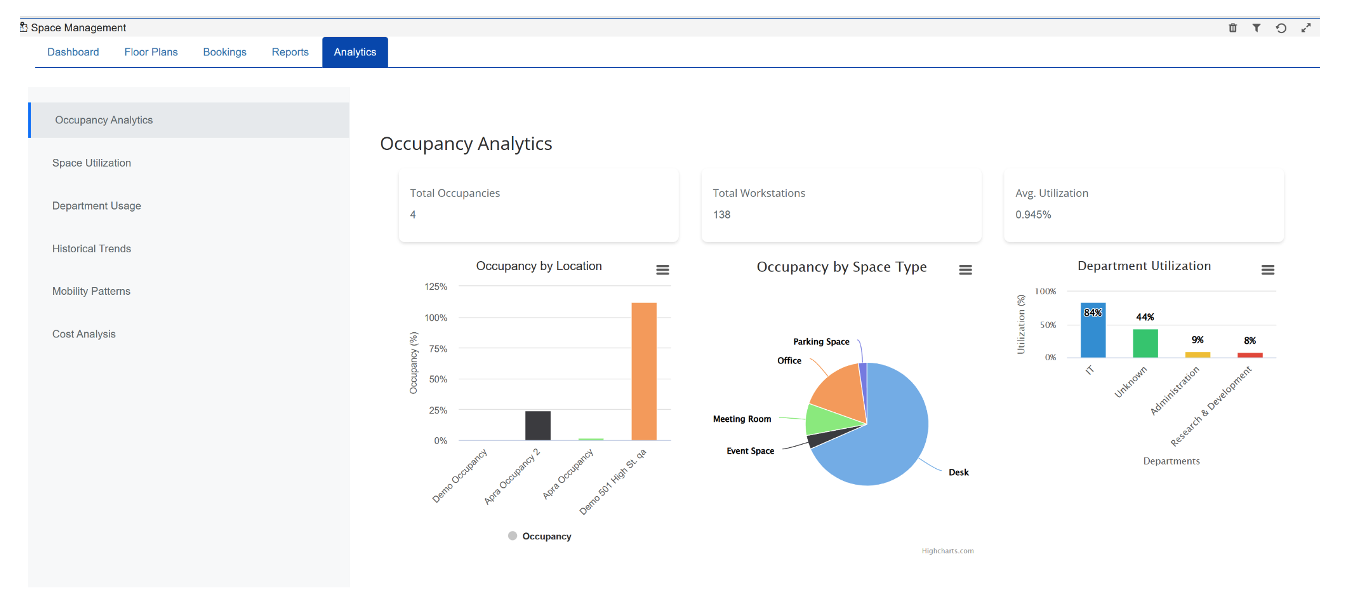
Analytics Dashboard.
Occupancy Analytics
- Integrated Analytics into the Dashboard for a unified, consistent view.
- Provides direct access to occupancy, space type, and department utilization insights within the Dashboard.
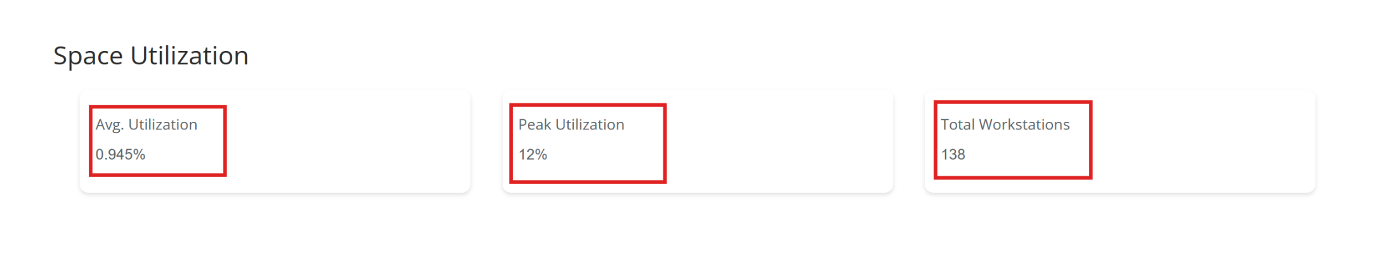
Space Utilization
Displays Avg. Utilization, Peak Utilization, and Total Workstations in a clean, card-based layout.
- Provides a quick snapshot of space performance for easier monitoring
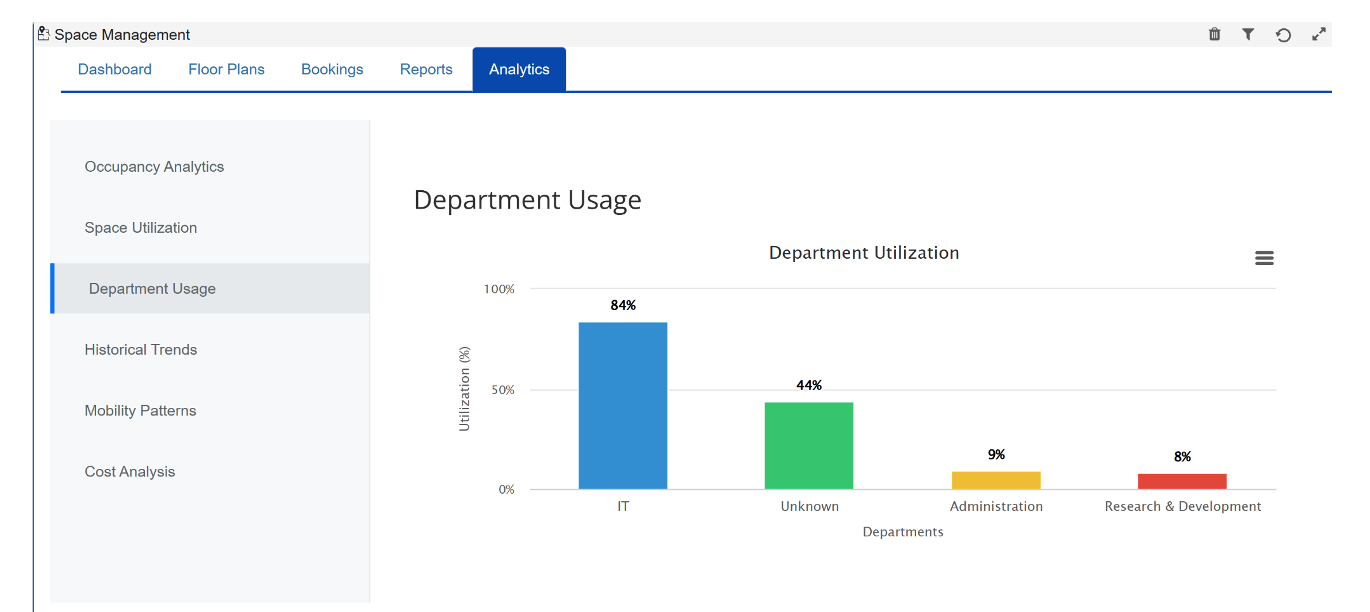
Department Utilization
Improved tracking and visualization of department-level utilization, helping teams identify where resources are being most used.
- Department utilization is calculated based on the Department Name field in person profiles, ensuring accurate reporting.