August 2, 2026
Signal (Renamed from Logbook)
a. Module Rebrand
- The Logbook module has been renamed to Signal across BluSKY Web, including the left-navigation menu label, page titles, and all related filters (previously "Log Book Type," now Signal Type; previously "Log Book Status Type," now Signal Status Type; previously "Log Book Entry Type," now Signal Entry Type).
New Signal Analytics Graphs
11 new analytics graphs have been added to the Analytics dashboard under the Signal category. Most graphs share a common filter set -- Group, System, Facility, Date Range, Signal Type, Signal Status Type, Signal Entry Type, and Time Zone -- while the summary-based graphs swap Signal Status/Entry Type for a single Signal Time Period filter (Hourly, Daily, Weekly, and so on).
a. Activity Heatmap
-
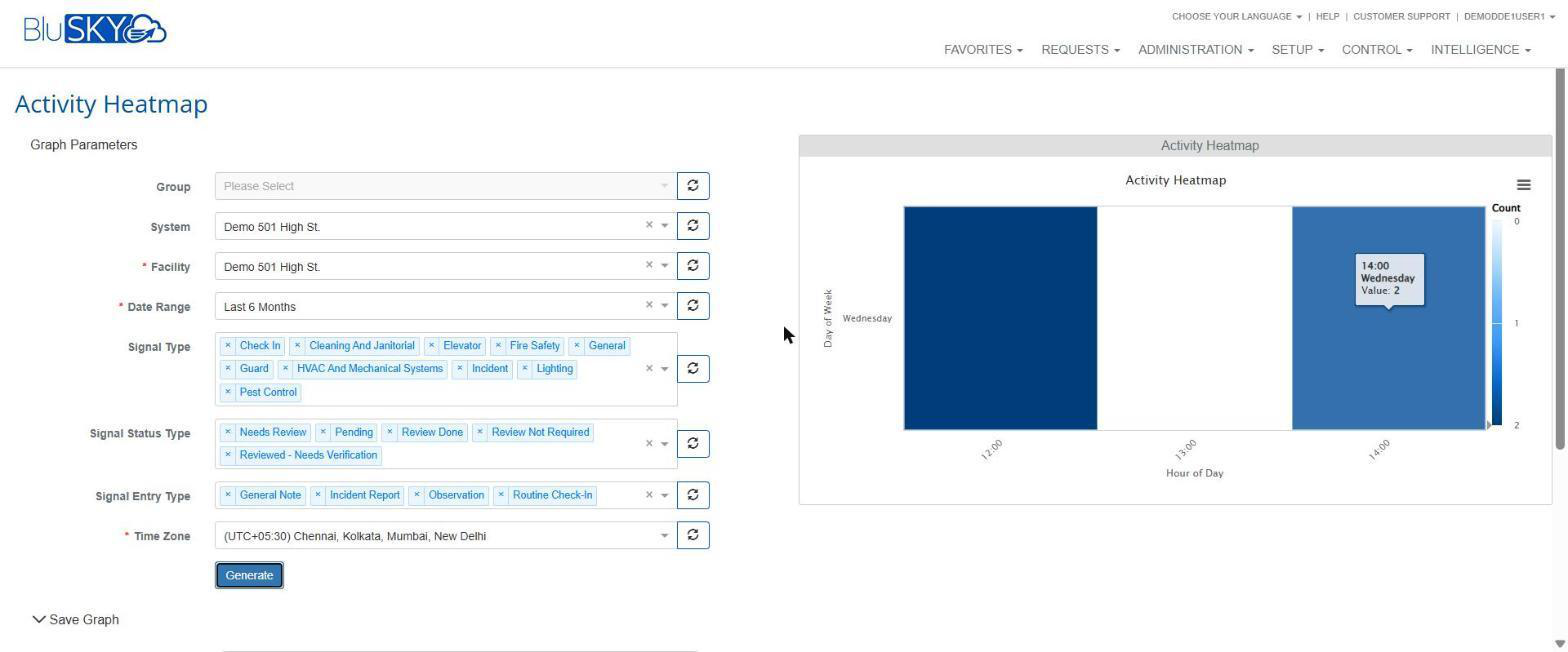
Chart type: Grid heatmap.
-
Visualizes logging activity intensity across time dimensions -- Day of Week on the Y-axis, Hour of Day on the X-axis -- with a color-coded Count scale (darker = more activity).
-
Helps operators quickly spot recurring high-activity windows, such as shift changes or peak foot traffic, or unusual after-hours logging, without scanning individual entries.
b. Amendment Rate
-
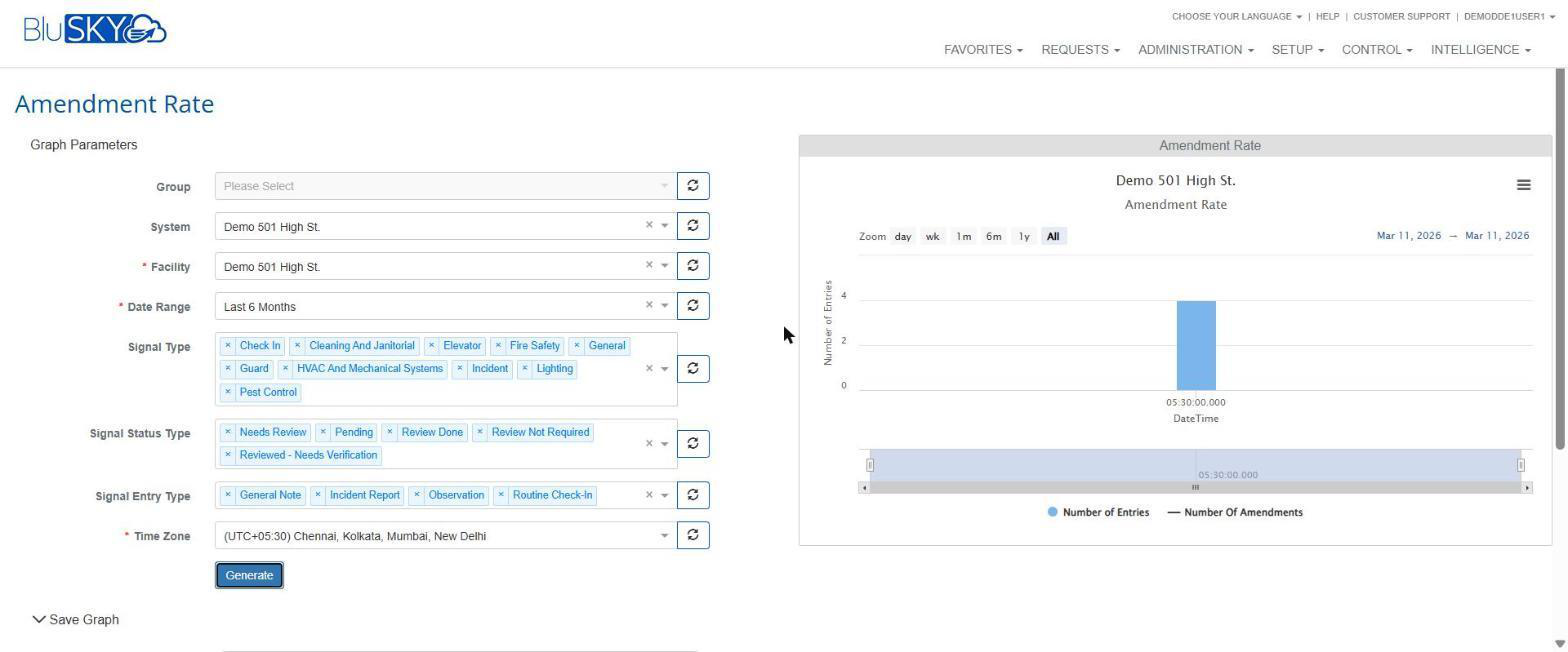
Chart type: Stock / time-series.
-
Plots two series over time -- Number of Entries and Number of Amendments -- so supervisors can track how often existing entries are edited relative to how many are created.
-
A rising amendment rate can flag data-quality issues, unclear entry procedures, or entries being revisited after initial review.
c. Average Risk Score Trend
-
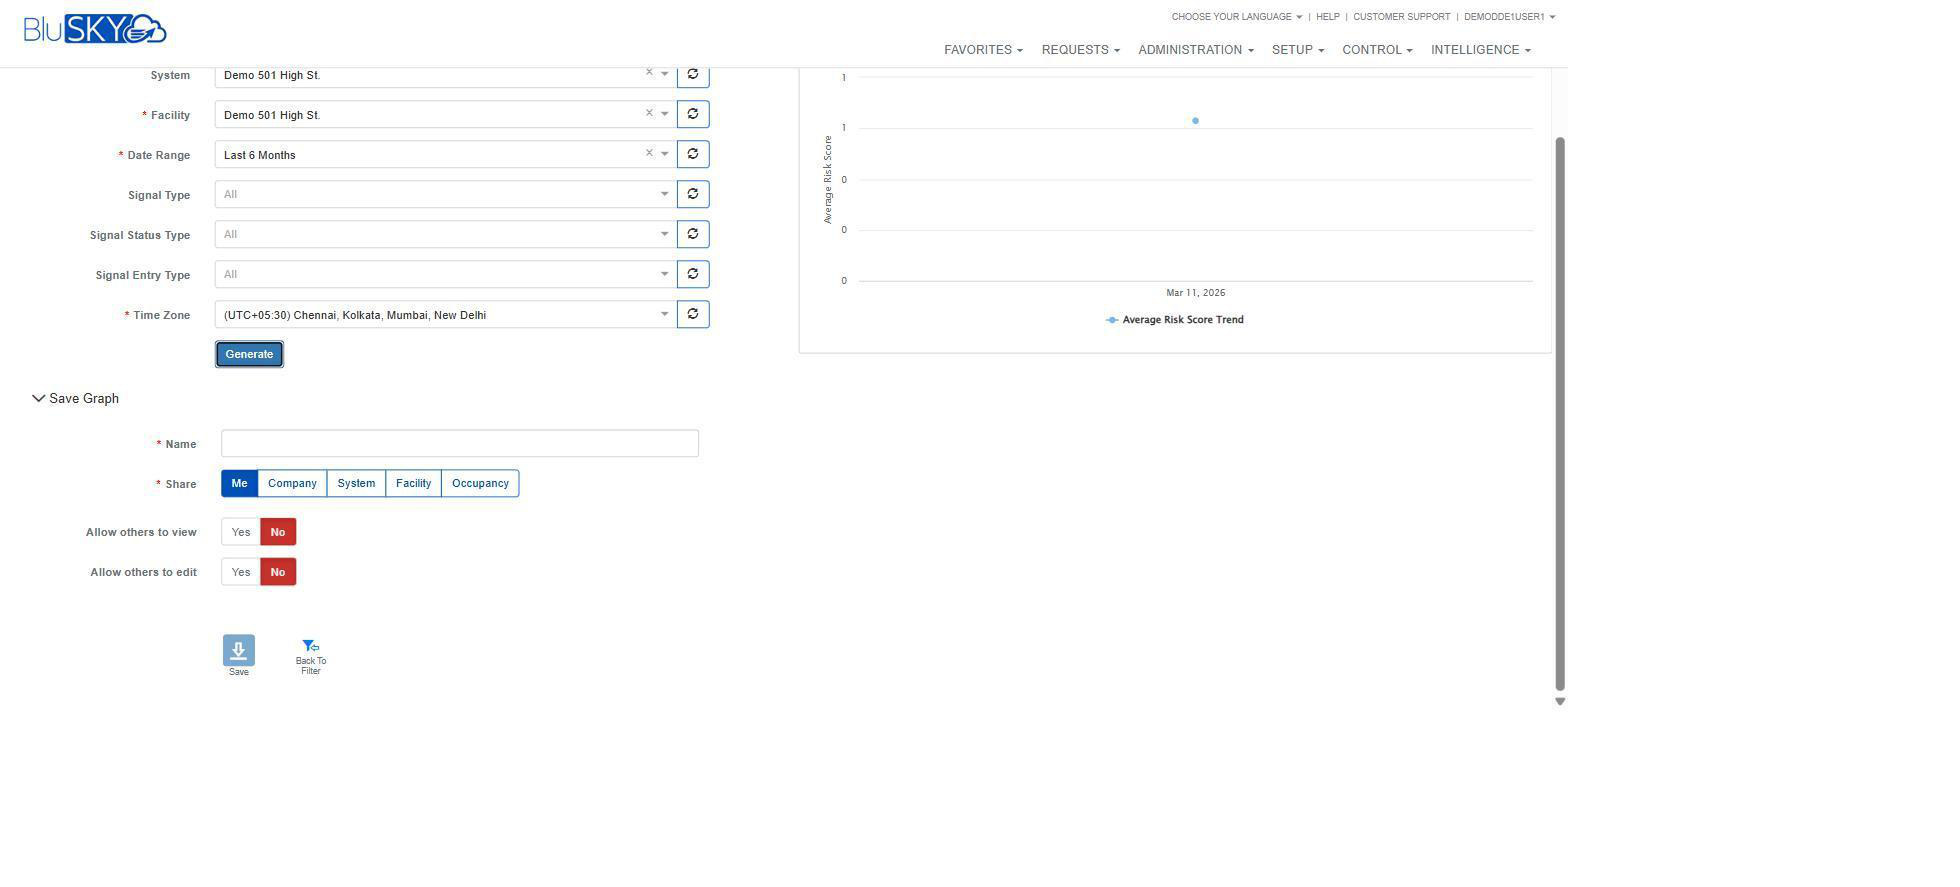
Chart type: Line.
-
Charts the average AI-calculated risk score of log entries over time.
-
Lets operators see whether overall entry risk is trending up or down for a facility, independent of entry volume -- useful for spotting a gradual escalation in incident severity that a simple entry count wouldn't reveal.
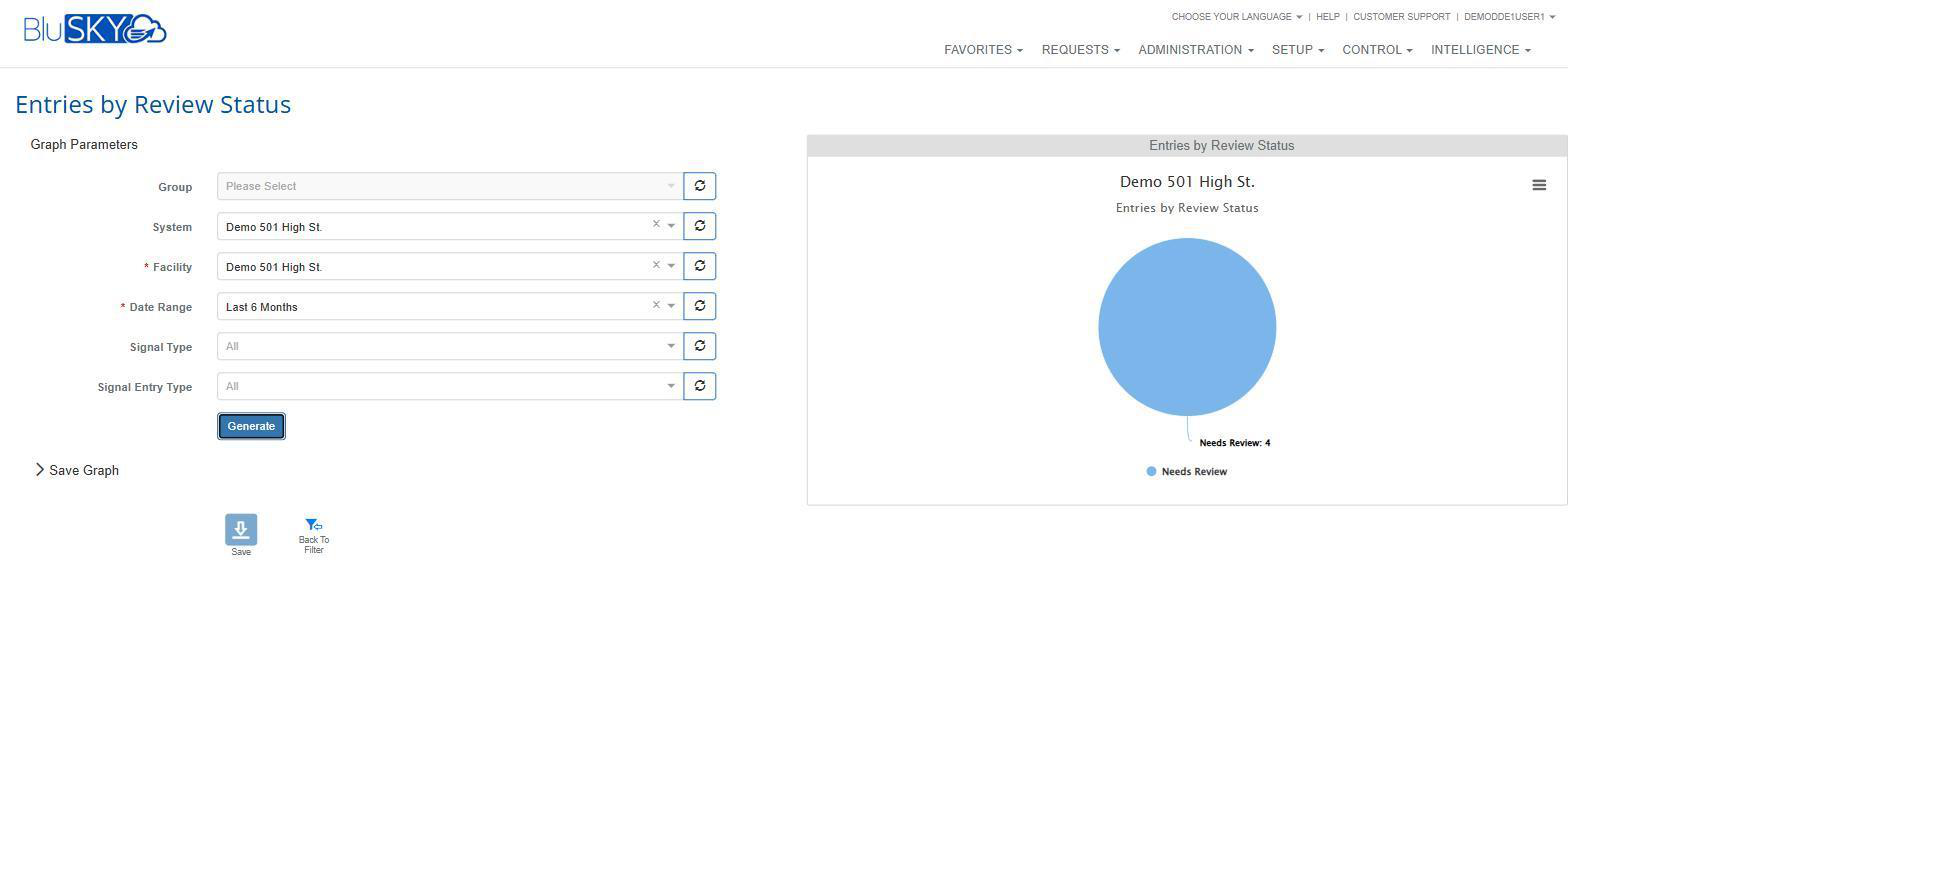
d. Entries by Review Status
-
Chart type: Pie.
-
Breaks down all entries in the selected scope/date range by review status -- Needs Review, Pending, Review Done, Review Not Required, and Reviewed - Needs Verification.
-
Gives supervisors an immediate sense of review backlog: a chart dominated by "Needs Review" signals entries are piling up faster than they're being cleared.
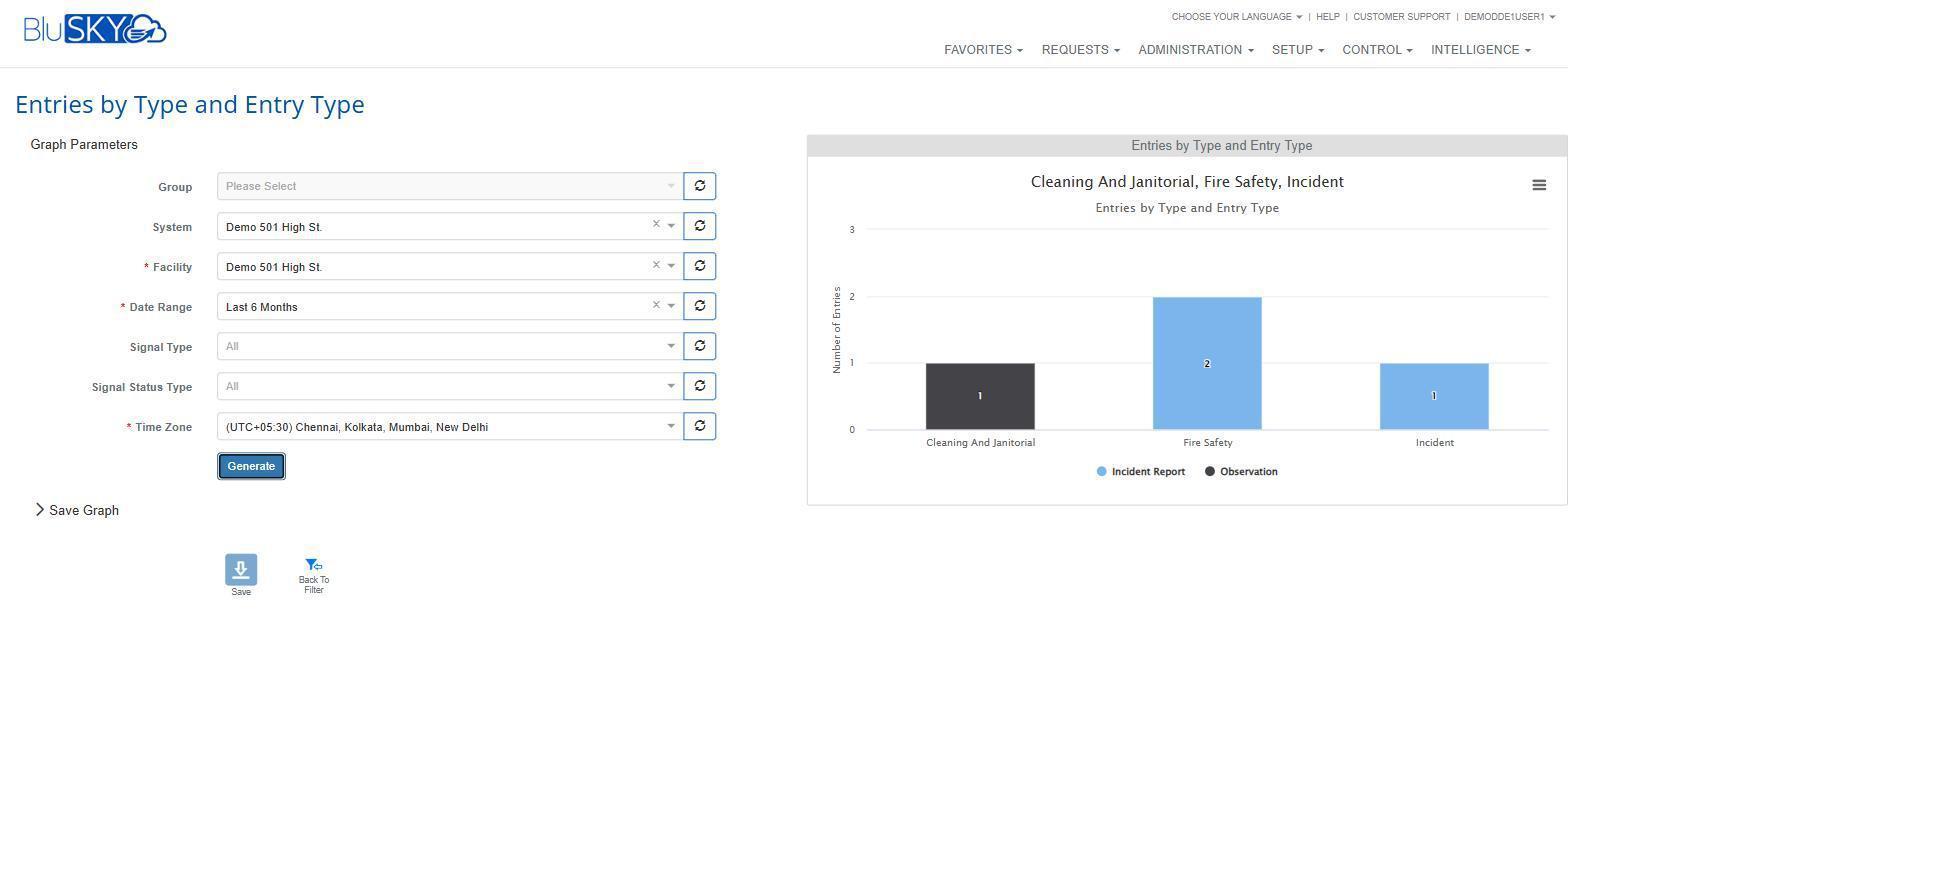
e. Entries by Type & Entry Type
-
Chart type: Column.
-
Cross-tabulates entry counts by Signal Type (e.g., Cleaning and Janitorial, Fire Safety, Incident, HVAC and Mechanical Systems) with each bar segmented by Entry Type (Incident Report, Observation, General Note, Routine Check-In).
-
Useful for identifying which categories of logged activity are most common, and whether certain types skew toward incident reports versus routine notes.
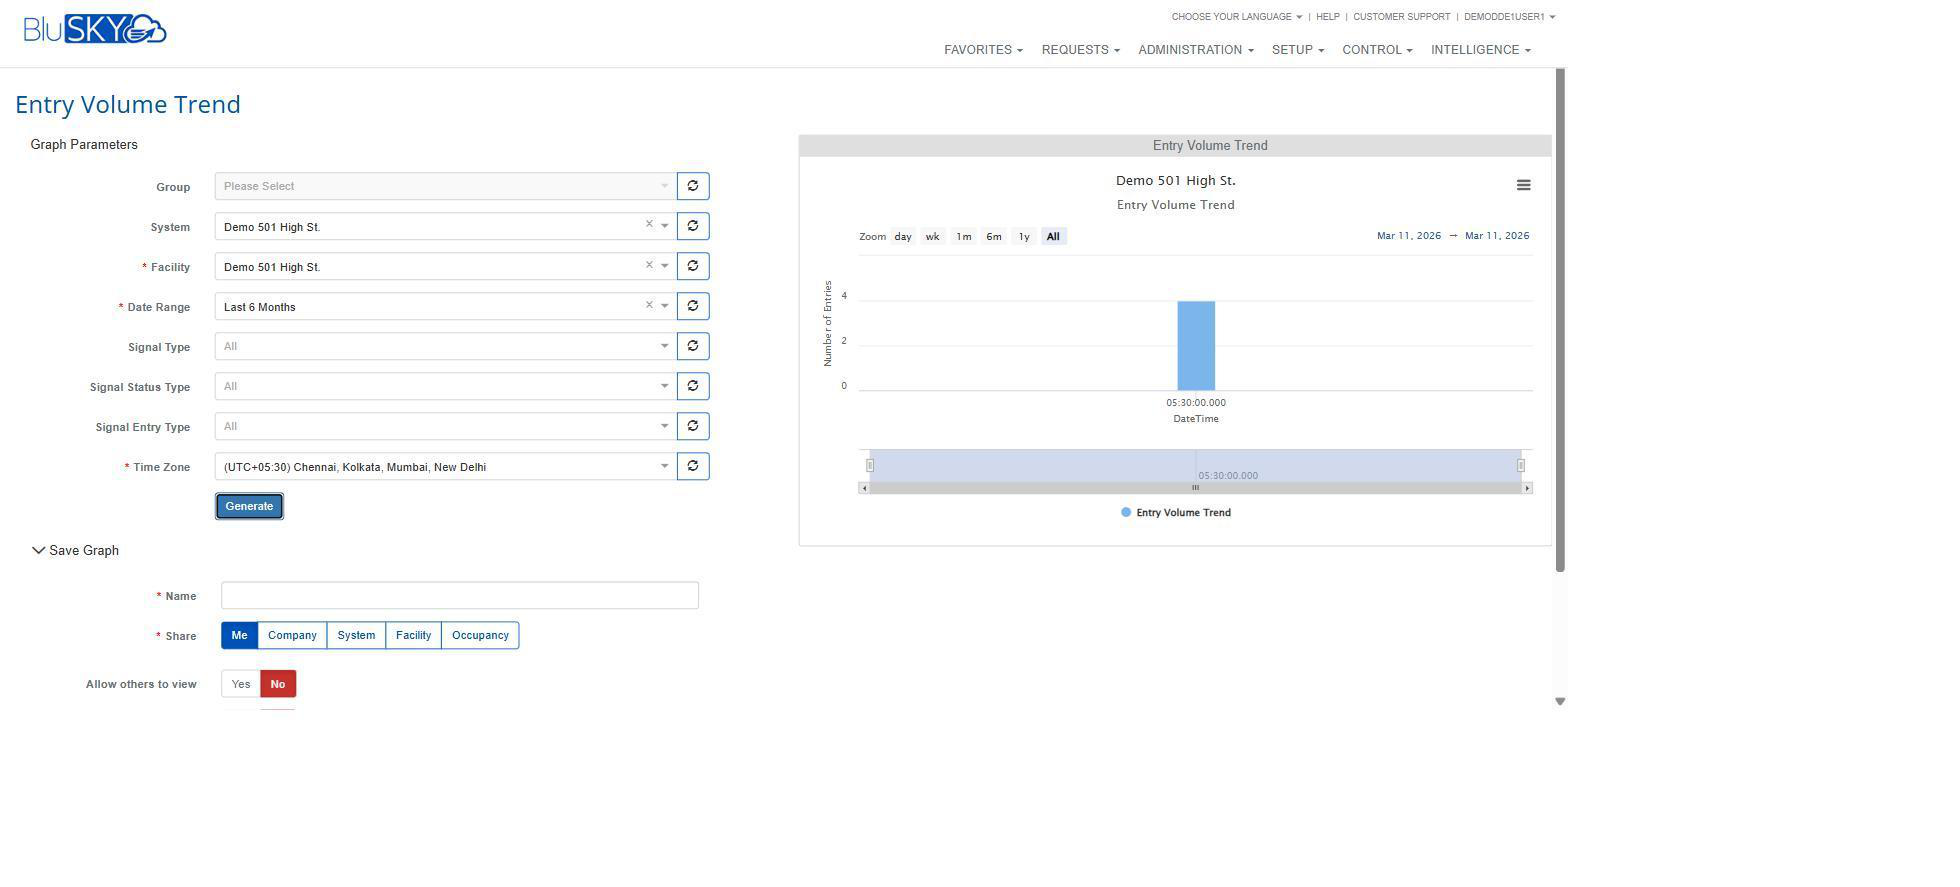
f. Entry Volume Trend
-
Chart type: Stock / time-series.
-
Tracks total log entry volume over time -- the baseline activity trend graph for Signal.
-
A quick way to see whether logging activity is increasing, decreasing, or holding steady over a chosen window, and to spot spikes tied to specific incidents or shifts.
g. High-Risk Summary Trend
-
Chart type: Stock / time-series.
-
Tracks the count of AI-generated Signal Summaries flagged as high-risk over time (per the Multi Reader, Multi Alarm, Ring IT, and ReadIT summary types).
-
Lets supervisors monitor whether the frequency of high-risk periods is climbing or falling across a facility.
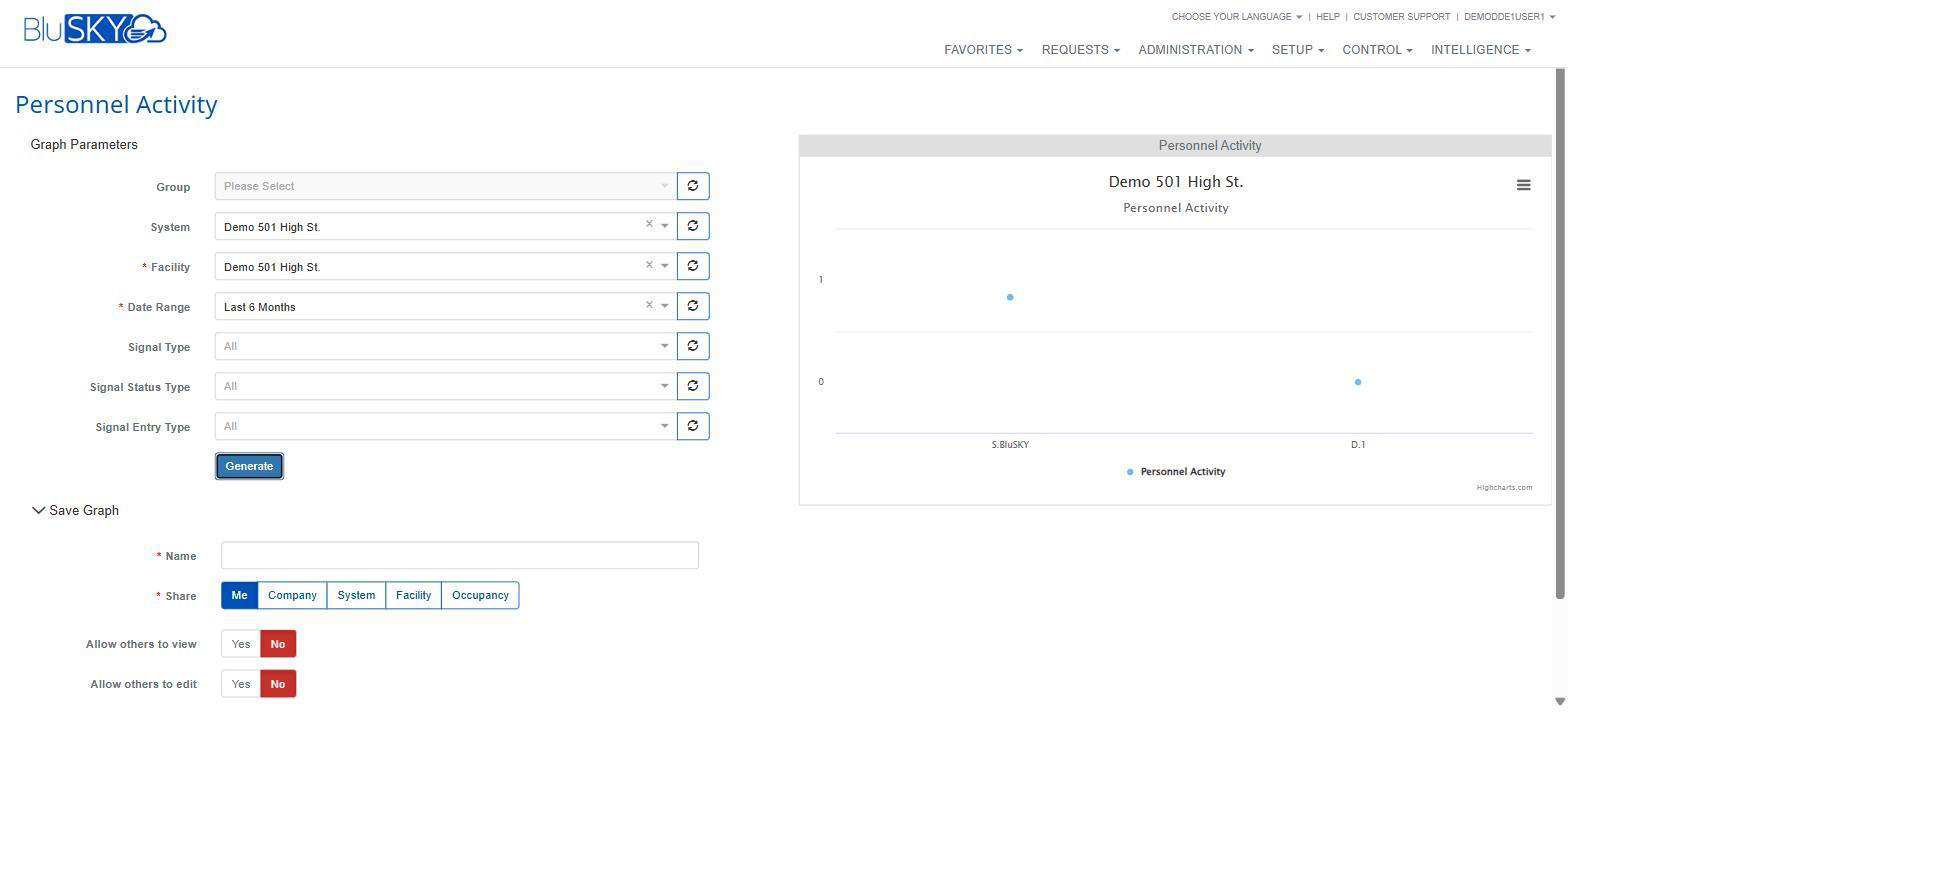
h. Personnel Activity
-
Chart type: Scatter.
-
Plots individual logging activity by person, with personnel names/identifiers along the X-axis and an activity metric on the Y-axis.
-
Helps identify which staff members are logging the most or least activity -- useful for spotting under-reporting, verifying shift coverage, or recognizing diligent logging by specific personnel.
i. Risk Score Distribution
-
Chart type: Column.
-
Buckets entries into risk-score bands and displays the count of entries per band, giving a distribution view of overall entry risk for a facility.
-
Complements Average Risk Score Trend by showing the shape of the distribution rather than just the trend line -- e.g., mostly low-risk with a small long tail of high-risk outliers, or risk spread more evenly.
j. Summary Risk by Operational Area
-
Chart type: Bar.
-
Compares summary-derived risk scores across different operational areas of a facility (e.g., by building, zone, or department, depending on configuration).
-
Helps facility managers quickly identify which areas are generating the most risk-flagged activity relative to others, supporting targeted follow-up or resourcing decisions.
k. Summary Risk Score Trend
-
Chart type: Stock / time-series.
-
Tracks risk scores derived specifically from Signal Summaries (as opposed to individual entries) over time, using the Signal Time Period filter to control the granularity of the trend line.
-
Gives a higher-level, summary-based view of facility risk that smooths out entry-by-entry noise -- useful for spotting sustained risk escalation across shifts or reporting periods.
BluCARE Intelligence
a. Global Category Identification
-
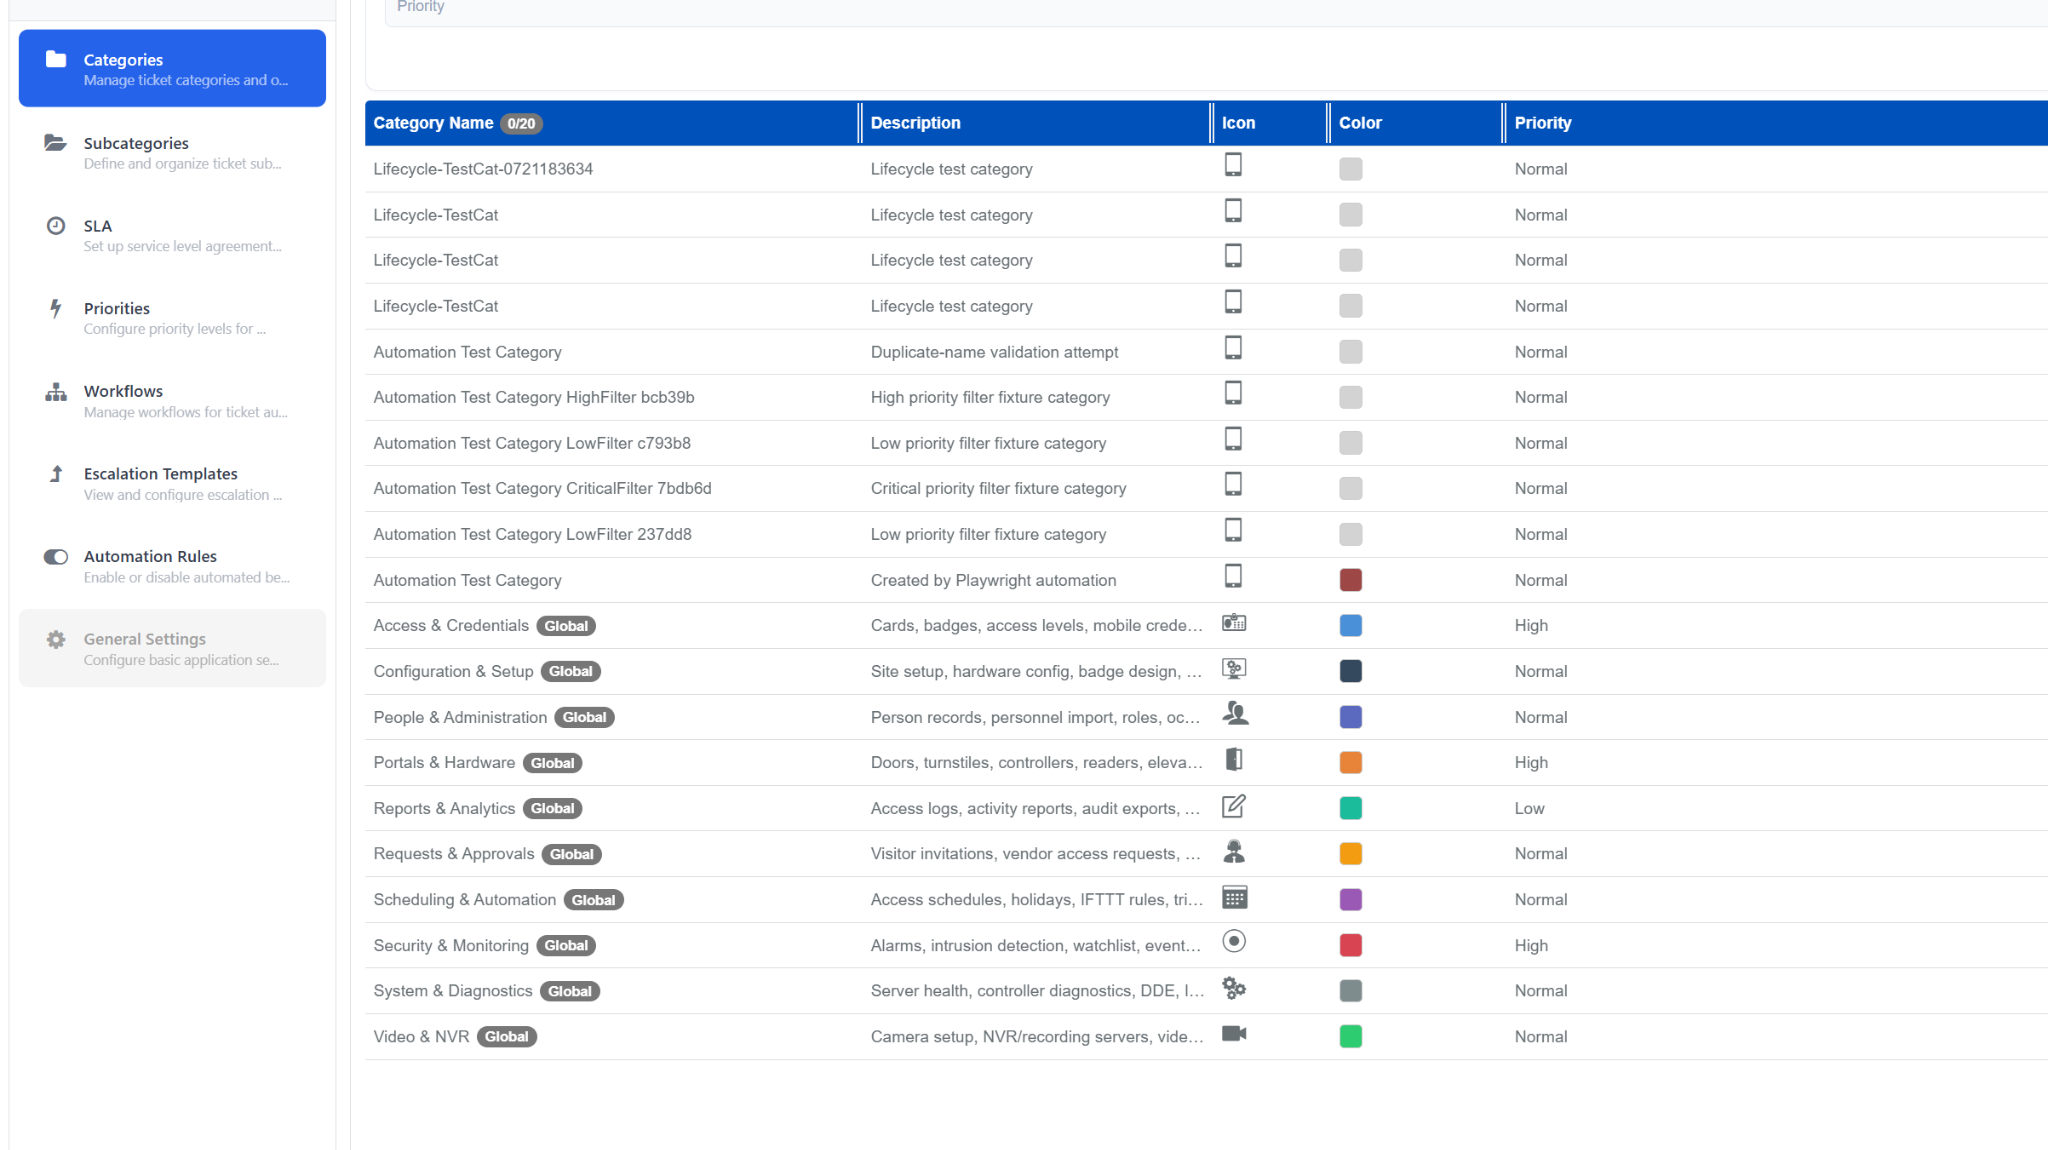
Added a Global tag to system-defined ticket categories for easier identification.
-
The Global tag clearly distinguishes built-in categories from user-created categories, making category management more intuitive.
-
Global categories are now consistently labeled throughout the AI Ticketing Configuration page.
b. Global Subcategory Identification
-
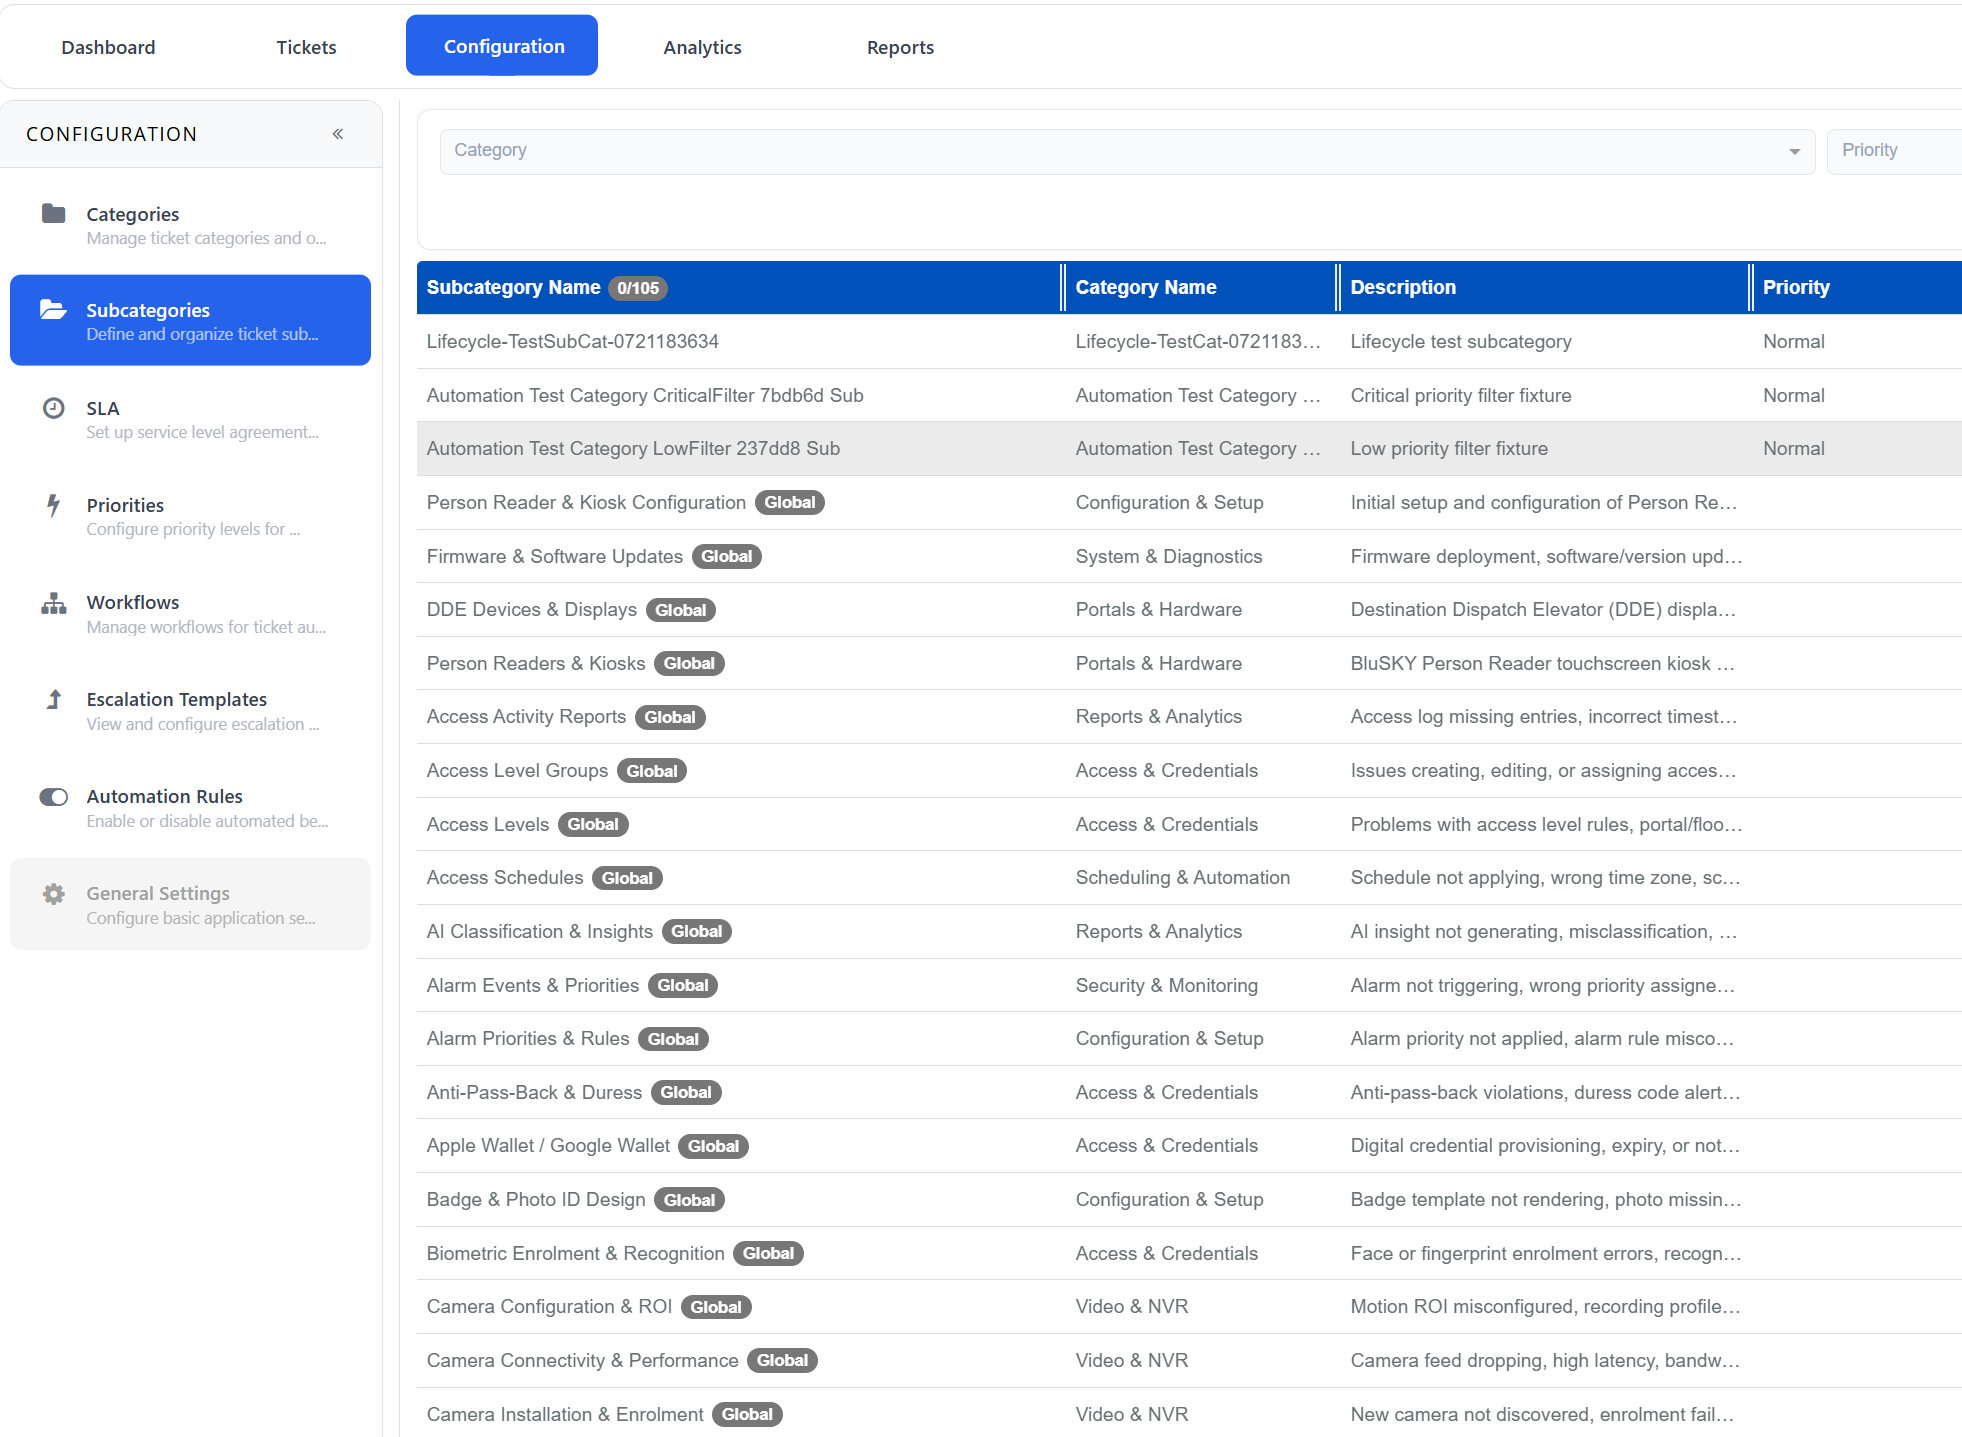
Added a Global tag to system-defined ticket subcategories for easier identification.
-
The Global tag clearly distinguishes built-in subcategories from user-created subcategories, making configuration and management more intuitive.
-
Global subcategories are now consistently labeled throughout the AI Ticketing Configuration page.
c. Enhanced Default Ticket Filters
-
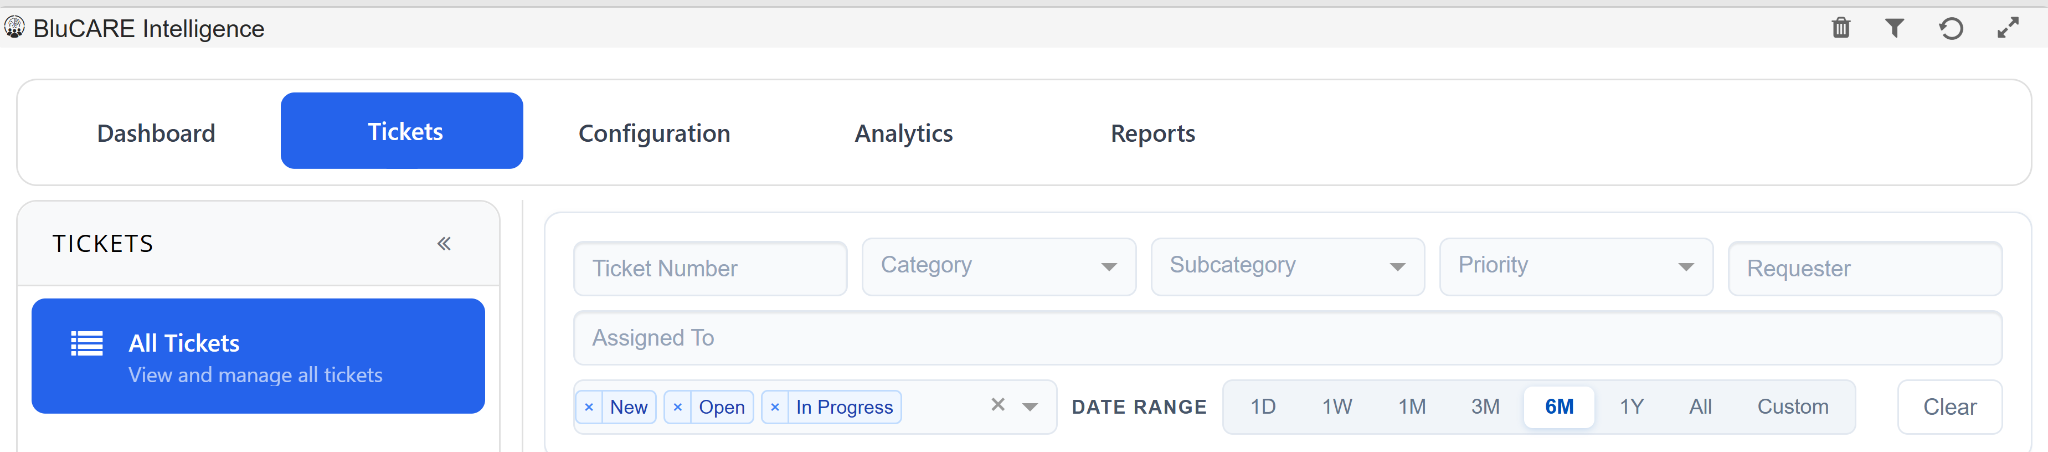
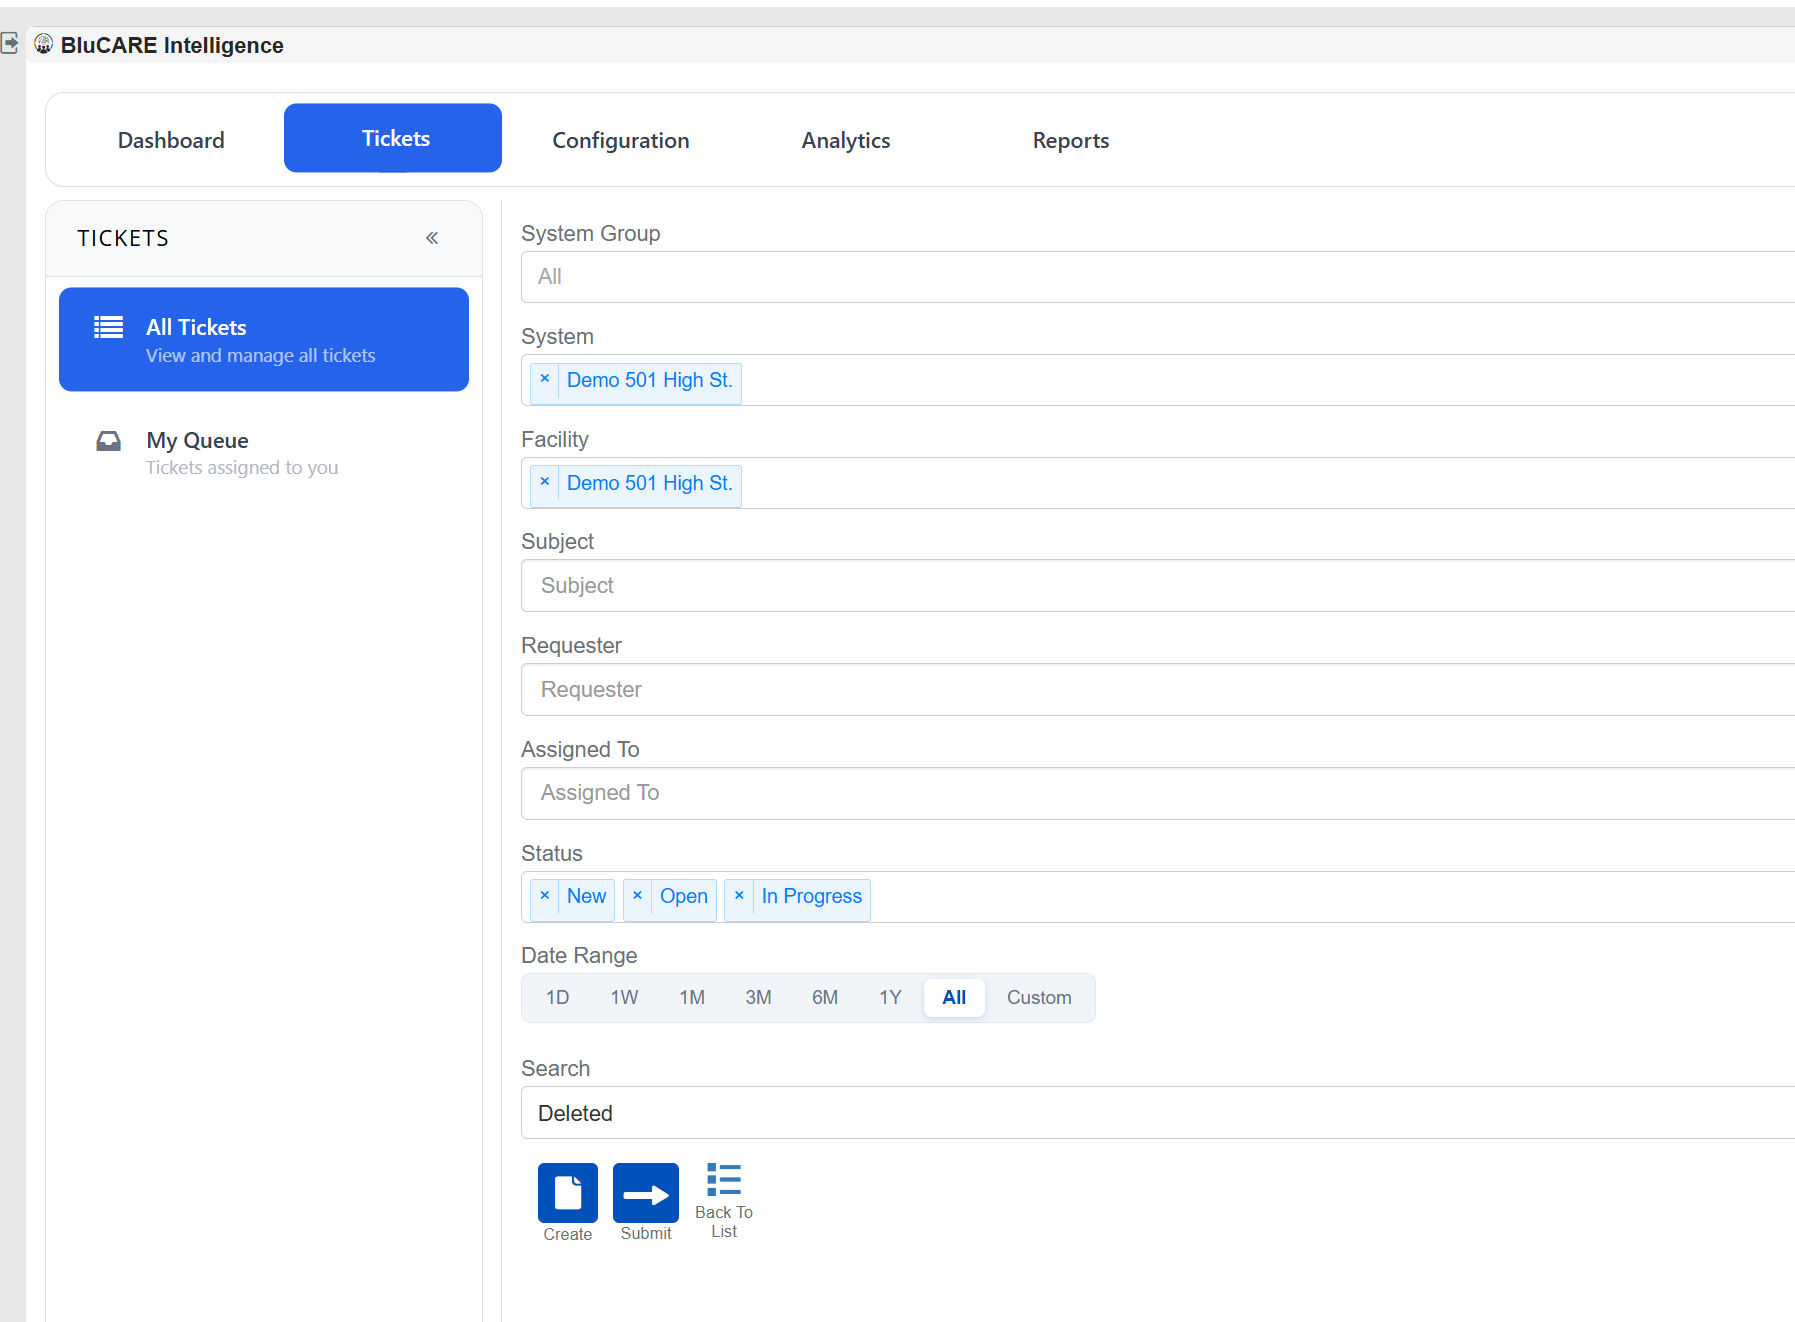
Updated the Status filter to automatically select New, Open, and In Progress tickets by default, helping users focus on active work immediately after opening the ticket list.
-
Enhanced the Date Range filter with predefined options: 1 Day, 1 Week, 1 Month, 3 Months, 6 Months, 1 Year, All, and Custom, providing quicker access to commonly used time periods.
-
These default filter improvements streamline ticket searches and reduce the need for manual filter configuration.
d. Enhanced Ticket Filters
-
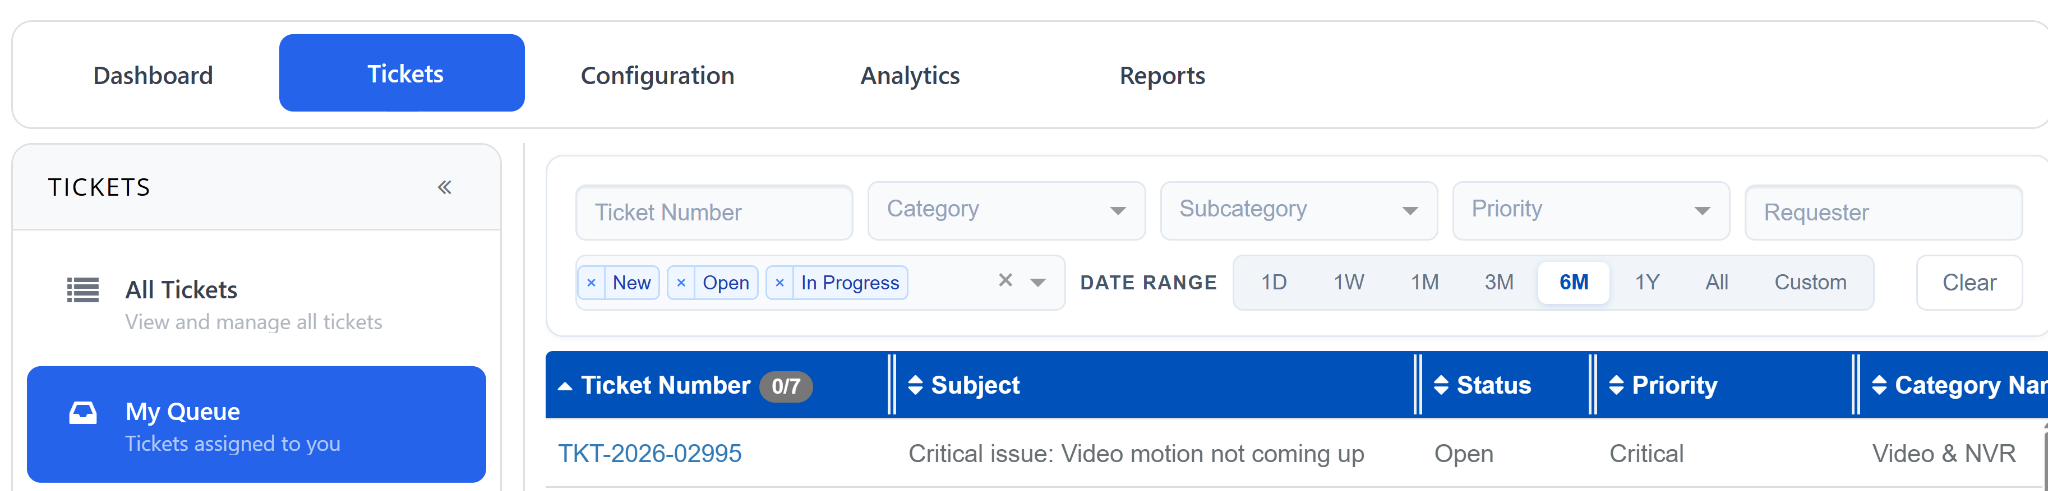
Added a Subject filter to quickly search tickets by their subject.
-
Added a Requester filter to find tickets created by a specific user.
-
Added an Assigned To filter to view tickets assigned to a particular user.
-
Added a Status filter to quickly narrow down tickets based on their current state.
-
Added an enhanced Date Range filter with predefined options: 1 Day, 1 Week, 1 Month, 3 Months, 6 Months, 1 Year, All, and Custom.
-
Added a Search field to quickly locate tickets using keywords such as ticket number, subject, or other searchable information.
-
These enhancements provide more powerful filtering capabilities, making it faster and easier to find and manage tickets.
e. Simplified Ticket Status Update
-
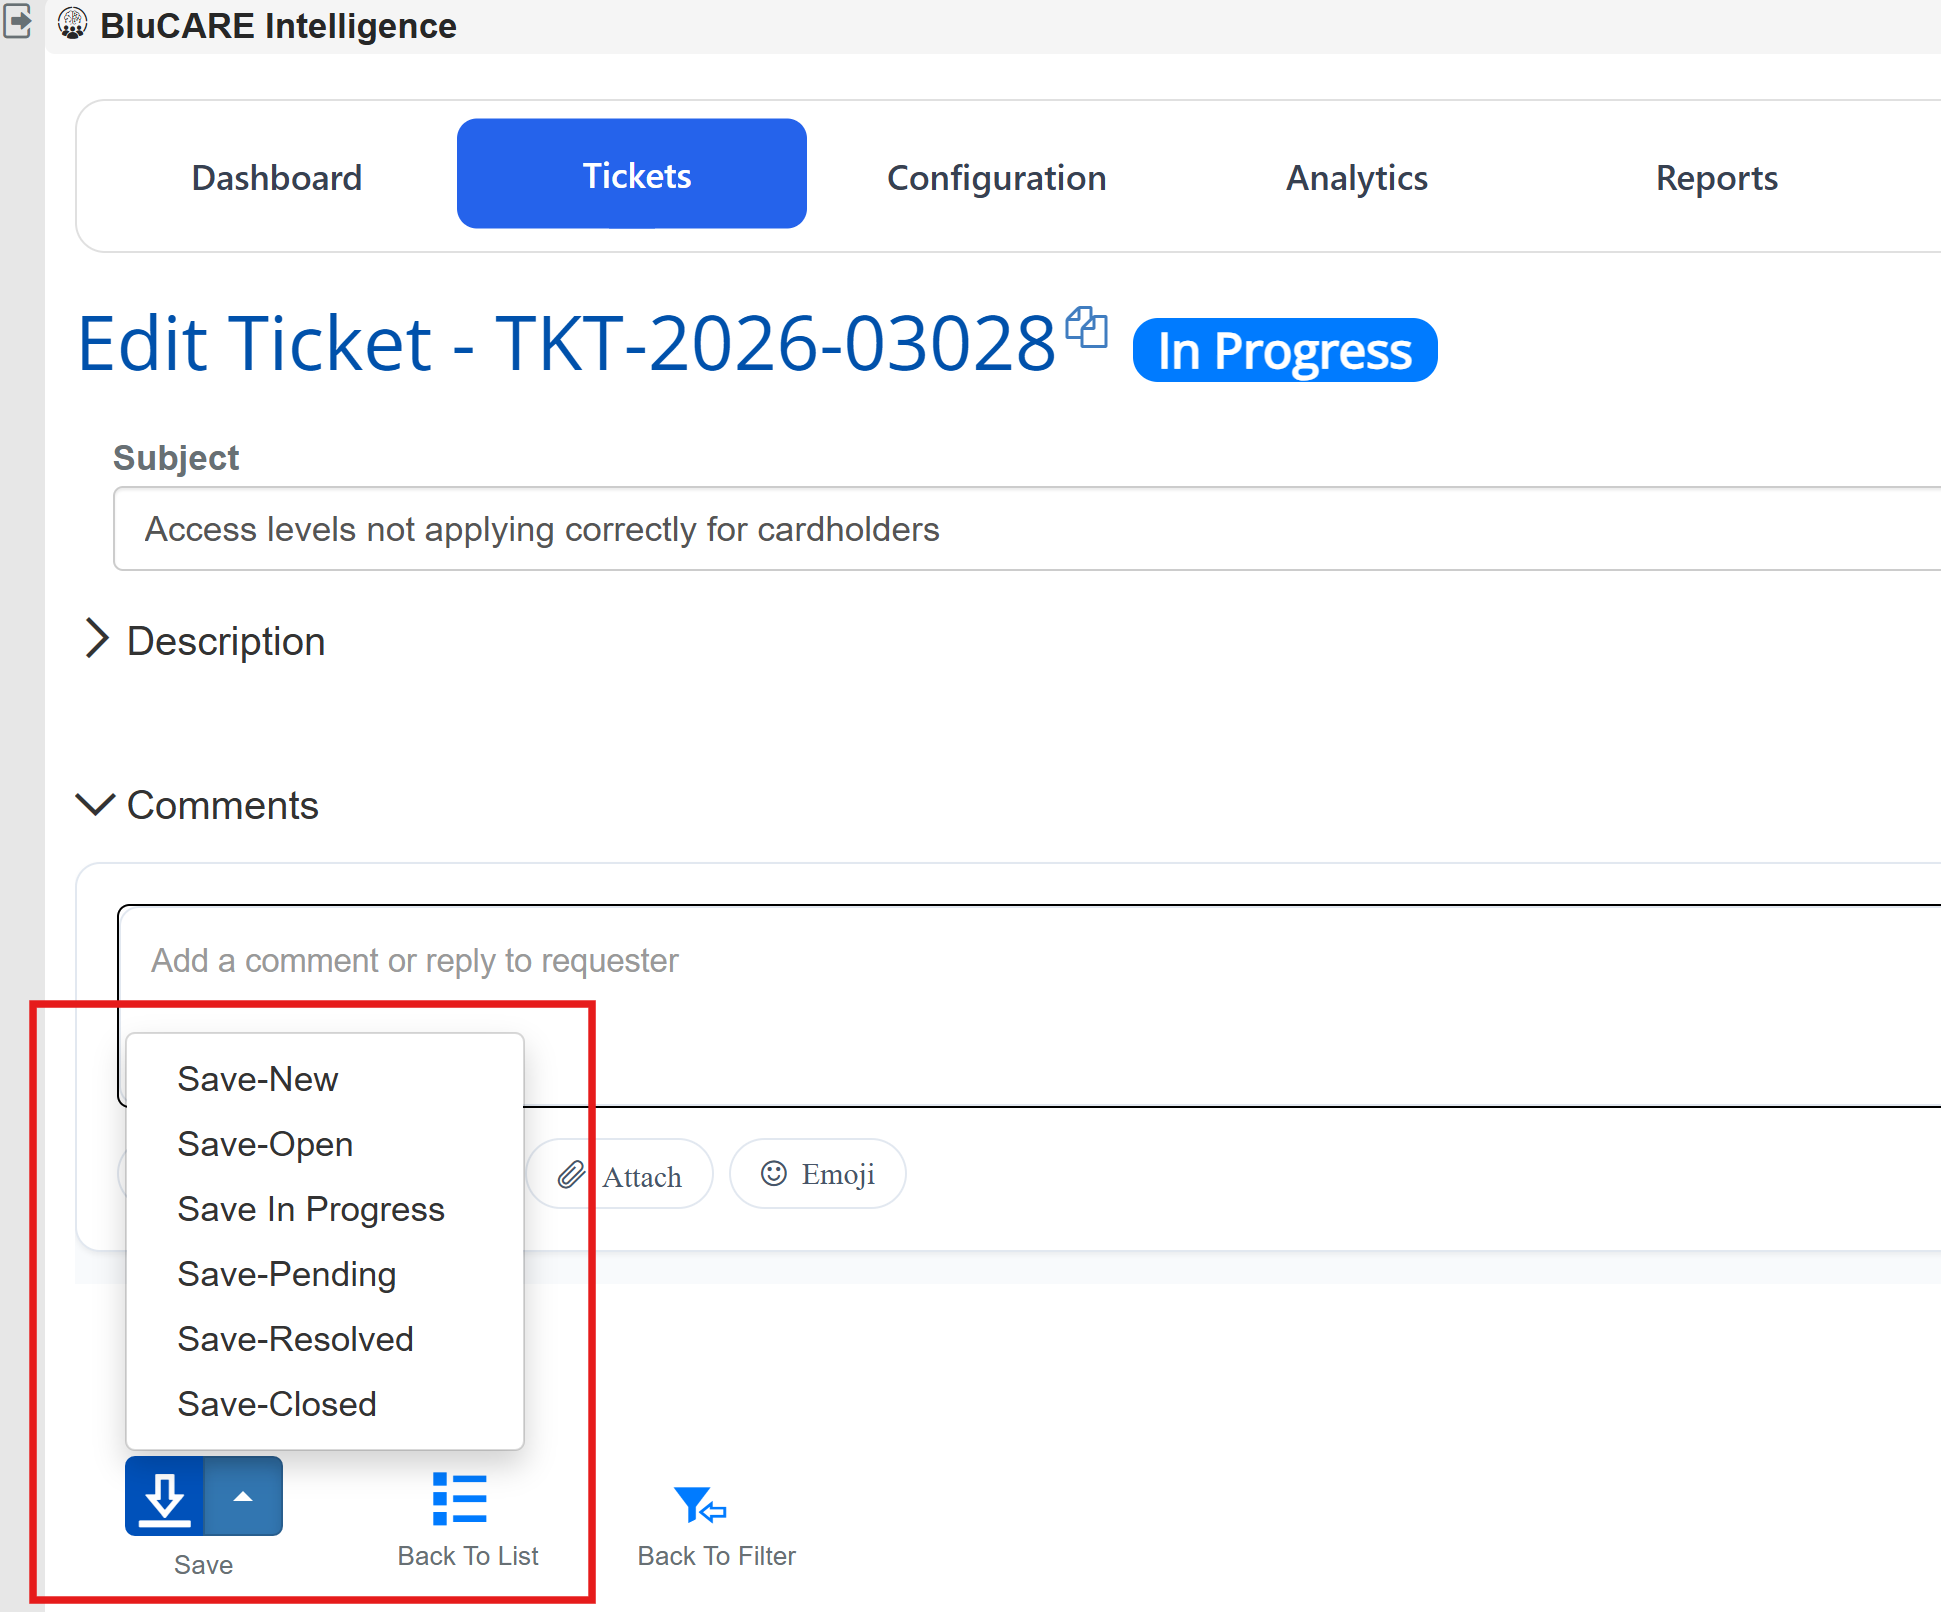
Replaced the separate Status field with a Save Action dropdown, allowing users to update the ticket status and save changes in a single step.
-
Added the following save options: Save-New, Save-Open, Save-In Progress, Save-Pending, Save-Resolved, and Save-Closed.
-
This enhancement streamlines the ticket update process by combining status selection and save into a single action, reducing clicks and improving usability.