May 2026
Interactive Maps Enhancements
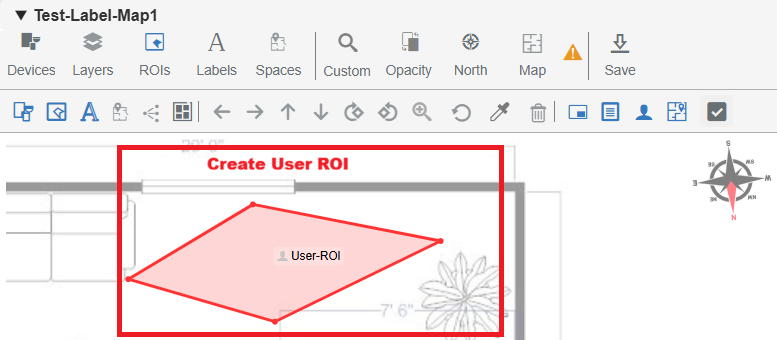
a. ROI Creation and Editing Enhancements
i. Users can now create ROIs in Edit Mode by drawing polygons with a minimum of three points. ROIs can be completed by double-clicking or closing the shape.
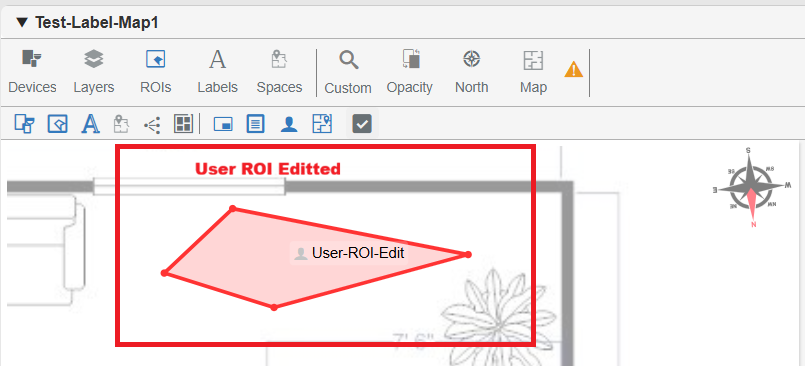
ii. Added support to edit ROI label text with validation to ensure minimum character requirements are met.
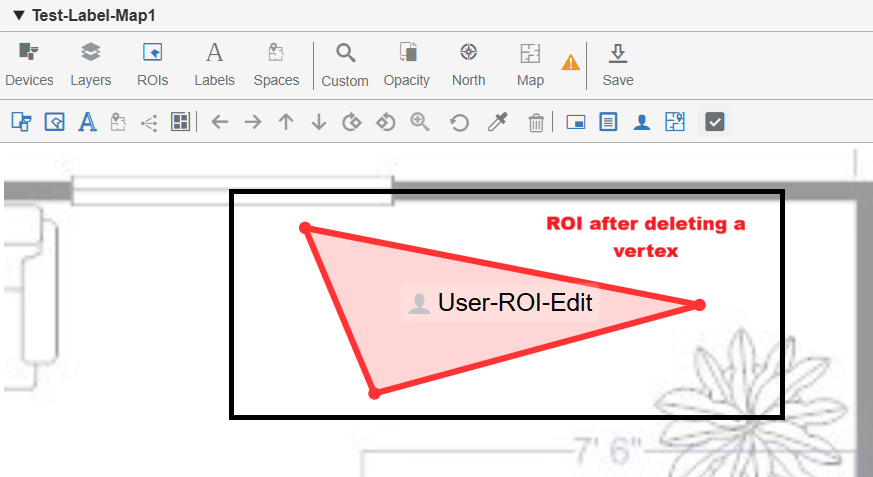
iii. Implemented delete functionality for user-created ROIs, including a confirmation prompt and soft-delete behavior.
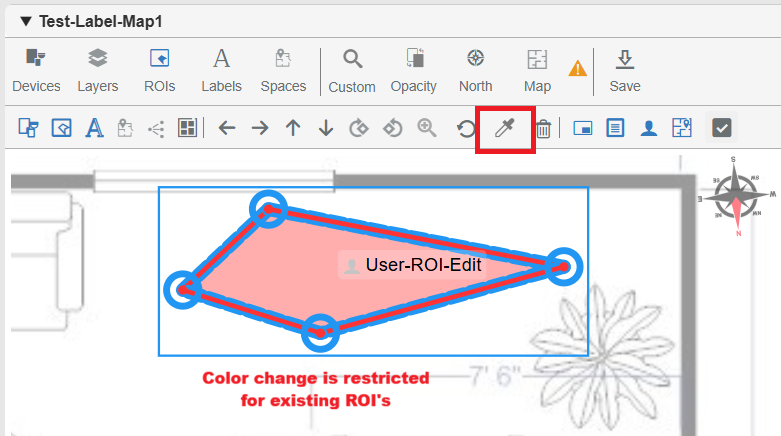
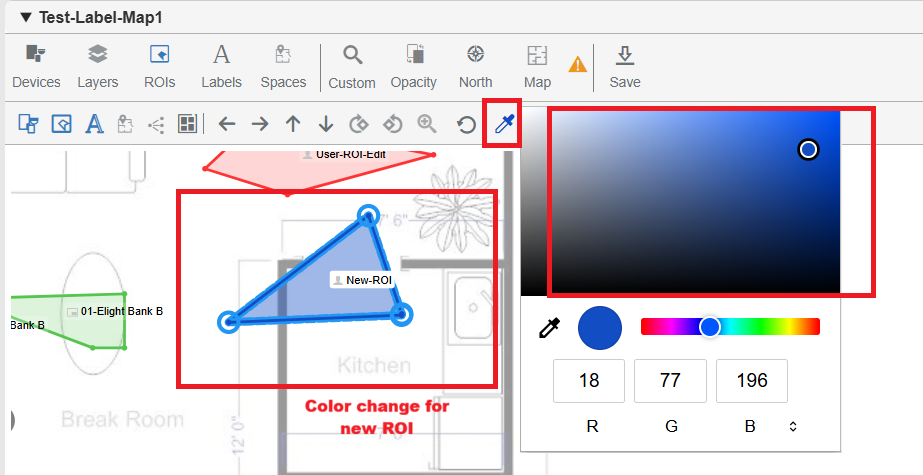
iv. Introduced color customization for newly created ROIs using a color picker, while restricting color changes for previously saved ROIs.
b. Label Drag Behavior Improvements
i. Restricted dragging of labels associated with ROIs, ensuring labels remain aligned with their corresponding polygons.
ii. Maintained drag functionality for standalone user labels (labels not linked to any ROI), allowing repositioning in Edit Mode.
iii. Disabled dragging for Detection, BluSKY, and DWG labels that are tied to ROIs; these labels can only be repositioned by moving the associated ROI.
iv. Displayed a validation message "LabelsCannotBeMoved" when attempting to move restricted labels using subtools.
c. ROI Editing and Multi-Select Enhancements
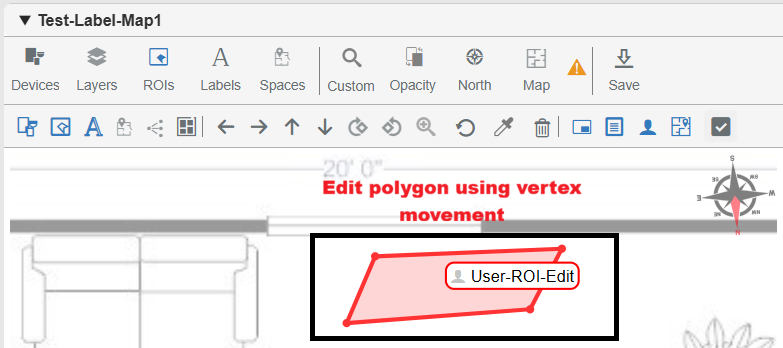
i. Enabled editing of User ROIs, including:
- Moving the entire polygon
- Adjusting individual vertices
- Updating label text
ii. Added support to modify BluSKY ROIs, allowing polygon movement and label updates.
iii. Introduced full edit support for DWG and Landmark ROIs, including move, label edit, and delete functionality.
iv. Implemented delete with confirmation for all supported ROI types, followed by soft-delete behavior.
v. Added multi-select capability for ROIs, enabling bulk operations such as move and delete where applicable.
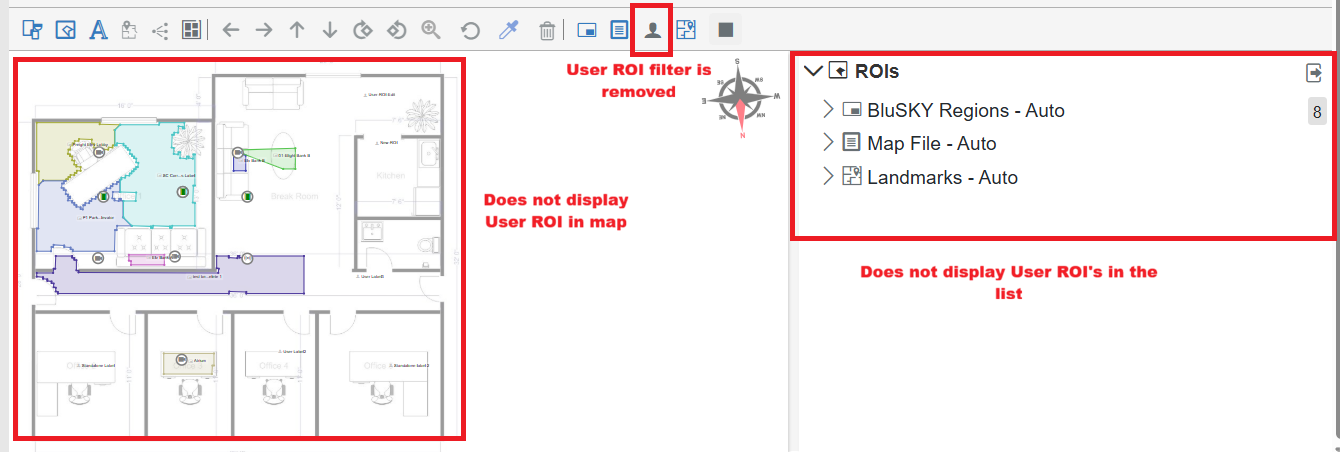
d. ROI List and Filtering Enhancements
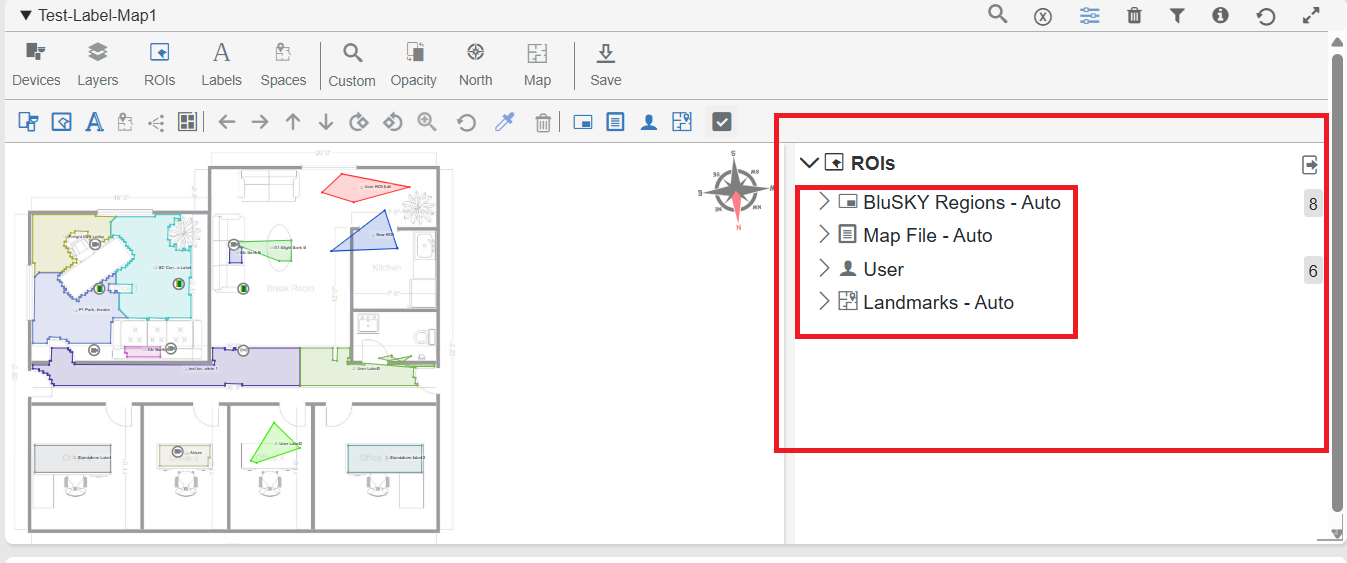
i. Added a right-side ROI list panel that displays all non-deleted ROIs for the selected map when the ROIs tool is active.
ii. Each ROI entry includes key details such as:
- Label text
- Generation source icon
- Category
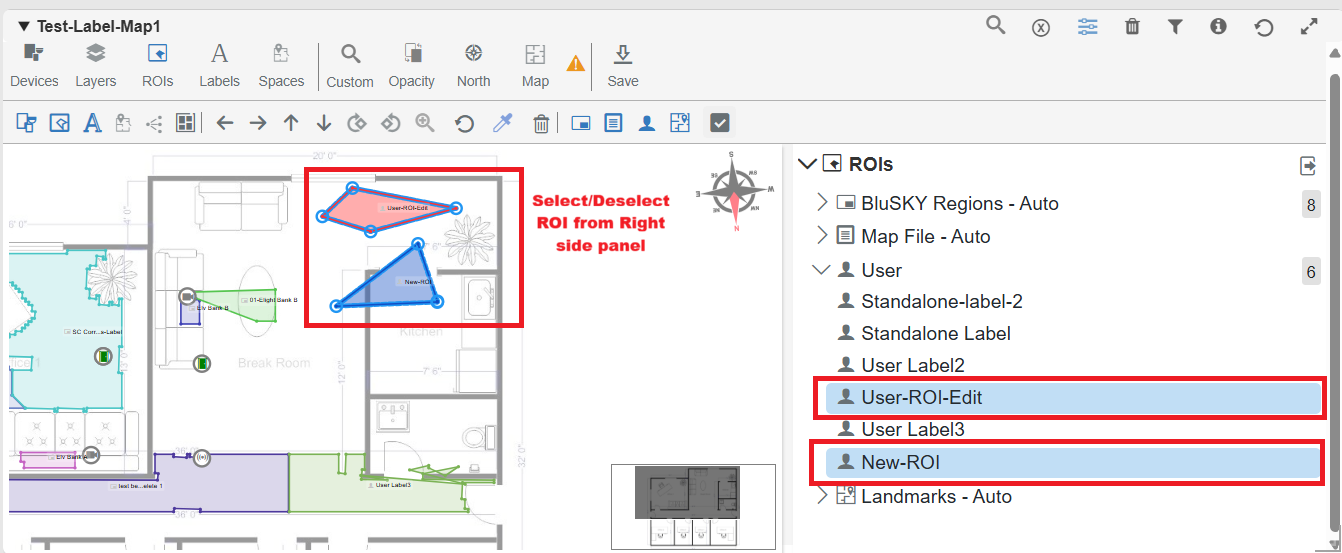
iii. Users can select ROIs from the list, which highlights the corresponding polygon on the map.
iv. Supported deselect functionality, removing highlights when an ROI is unselected.
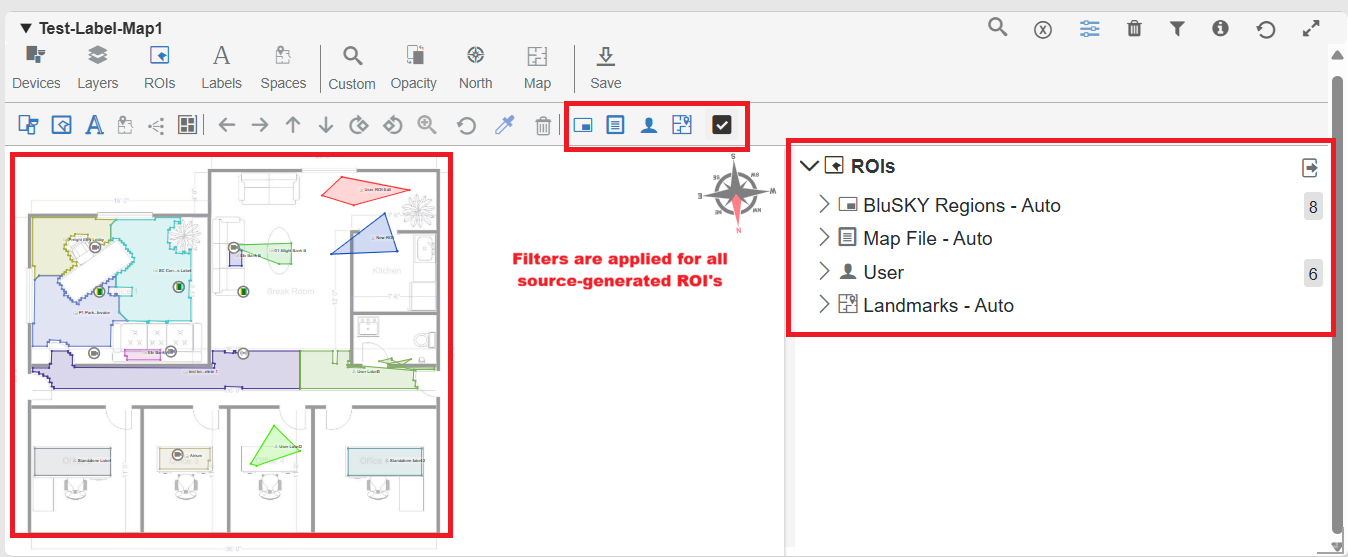
v. Introduced source-based filtering (BluSKY, DWG, User, Detection) to control ROI visibility consistently across both the map and the list.
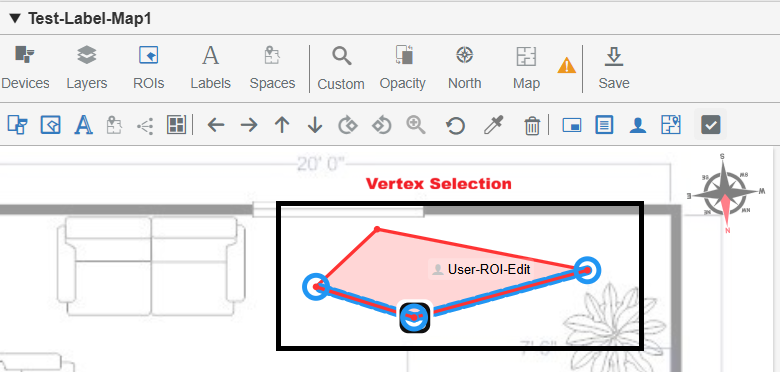
e. ROI Vertex Editing Enhancements
i. Enabled vertex selection in Edit Mode with support for single and multi-select, including visual highlighting for better visibility.
ii. Added the ability to insert new vertices by double-clicking on polygon edges, automatically splitting the edge.
iii. Supported real-time vertex movement, allowing dynamic updates to polygon shapes during editing.
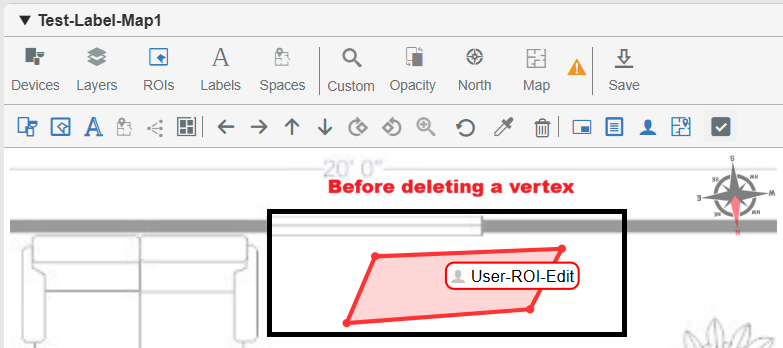
iv. Implemented vertex deletion with validation, ensuring a minimum of three vertices is maintained for a valid polygon.
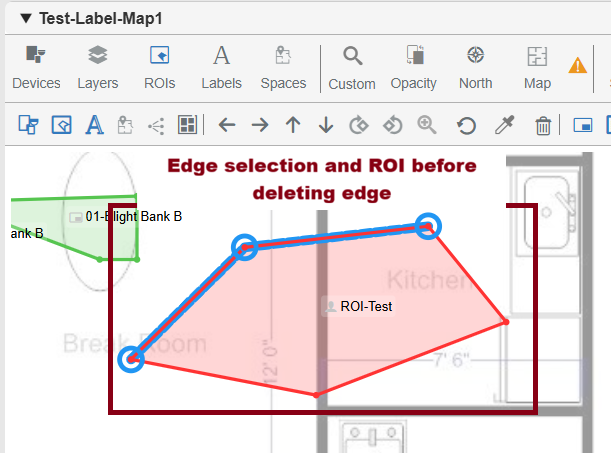
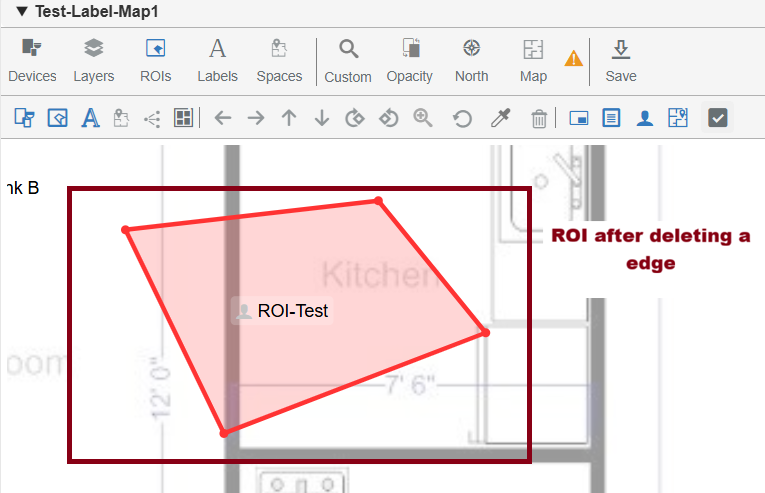
v. Added support for edge selection and deletion, removing connected vertices while maintaining polygon integrity.
f. Persistence of User Modifications on Auto-Generated ROIs
i. Ensured that user modifications to BluSKY (Auto) ROIs — including vertex edits, edge edits, label updates, and movement — are preserved even after pipeline execution.
ii. Ensured that user modifications to Landmark ROIs, including shape changes and label edits, persist across pipeline runs.
iii. Improved system reliability by preventing pipeline updates from overwriting user-customized ROI changes.
g. Optimized Pipeline Behavior for Maps
i. Enabled full detection processing for new maps, generating ROIs, labels, and mask data from scratch.
ii. Optimized pipeline execution for existing maps to reprocess only labels and regions when updates occur, avoiding unnecessary full detection runs.
iii. Ensured that existing detections and user modifications are preserved, preventing unintended overwrites during updates.
Camera Configuration Enhancements
a. Camera View List UI Improvements
i. Removed the redundant Status column from the Camera View List page to provide a cleaner and more streamlined layout.
ii. Increased the available horizontal space for the remaining columns, improving readability and overall visibility of camera information.
iii. Camera status visibility has been retained through the existing status icons and related UI indicators.
b. Camera Search Page Enhancements
Sorting Improvements:
i. Added sortable columns for:
- Name
- Recorder
- IP Address
- Floor
ii. All supported columns now allow both ascending and descending sorting for easier navigation and camera management.
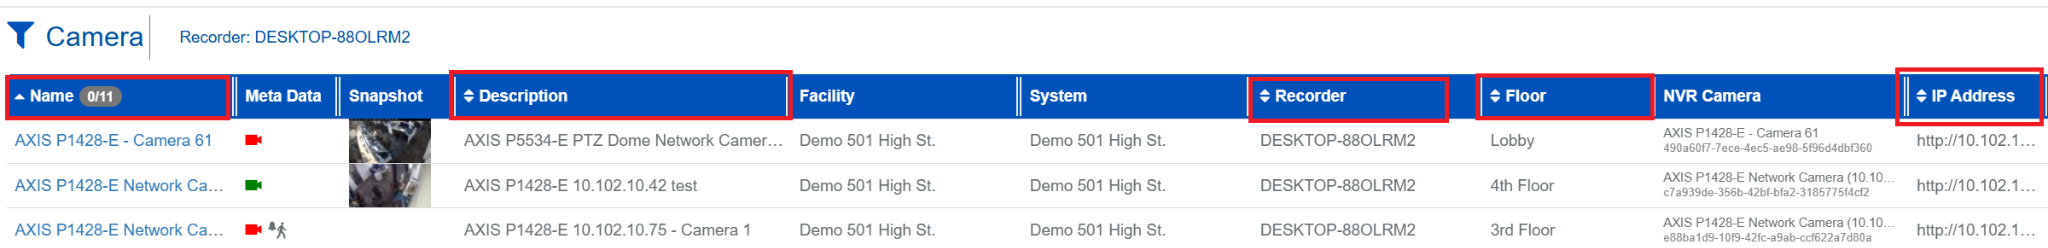
New Column Additions:
iii. Added a new Floor column displaying the associated floor name for each camera.
iv. Cameras without an assigned floor are grouped together for easier identification.
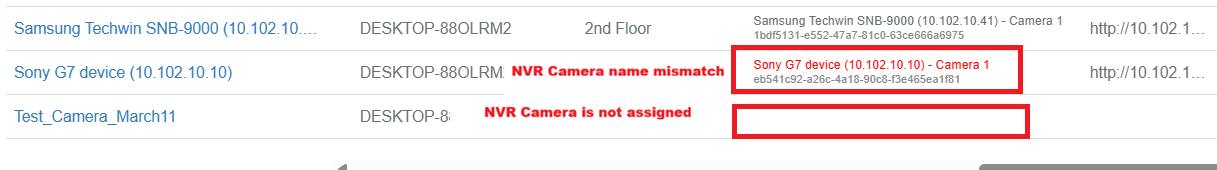
NVR Camera Column:
v. Added a new NVR Camera column displaying:
- NVR Camera Name
- Camera ID
vi. Information is displayed in a two-line format for improved readability.
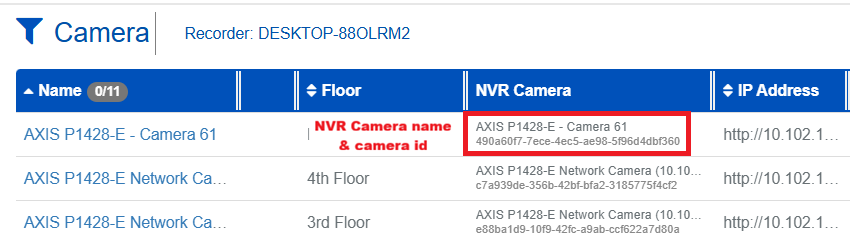
vii. If the NVR Camera Name does not match the configured value, it is highlighted in red to indicate a mismatch.
viii. The field remains blank when no NVR camera is assigned.
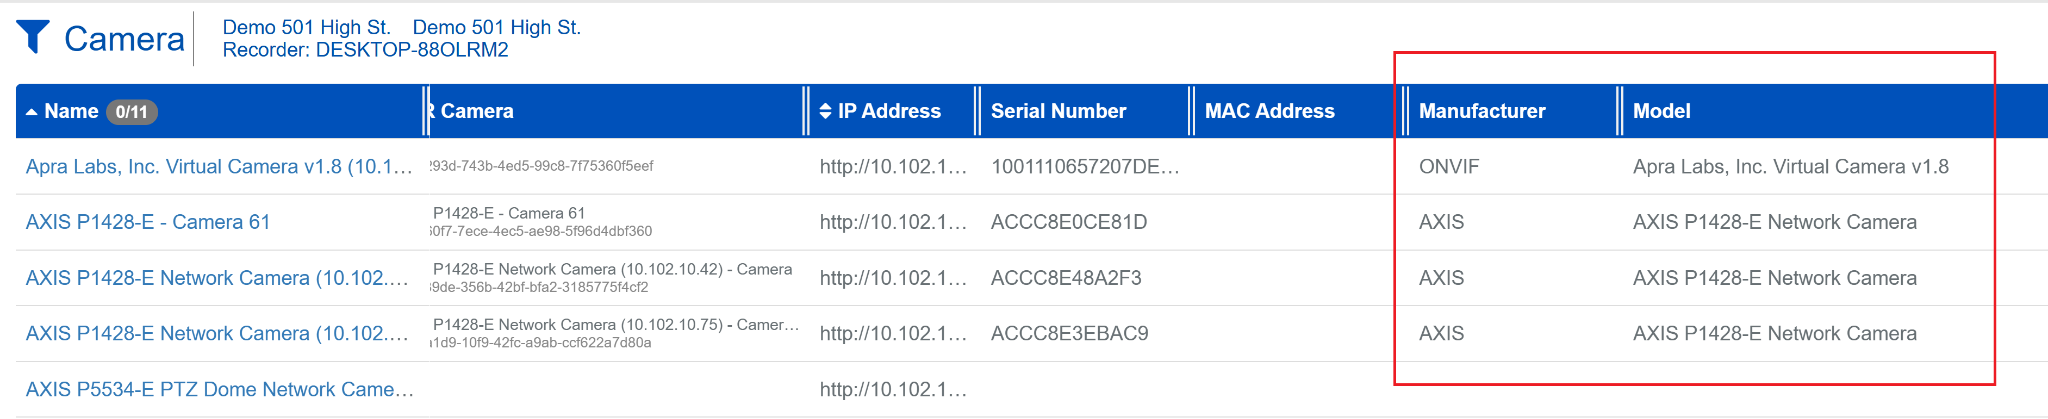
Manufacturer & Model Enhancements:
ix. Enhanced the Manufacturer & Model column to display merged values from both:
- BluSKY configuration
- NVR configuration
x. When values match, a single value is displayed.
xi. When values differ, both values are shown for easier comparison and validation.
c. Audit Logs Enhancements
i. Audit logs now display timestamps based on the selected timezone for improved readability and interpretation.
ii. The selected timezone is applied consistently across all audit log views to provide a unified experience.
iii. Custom timezone settings are fully supported, ensuring audit activity reflects the user's preferred local time instead of UTC.
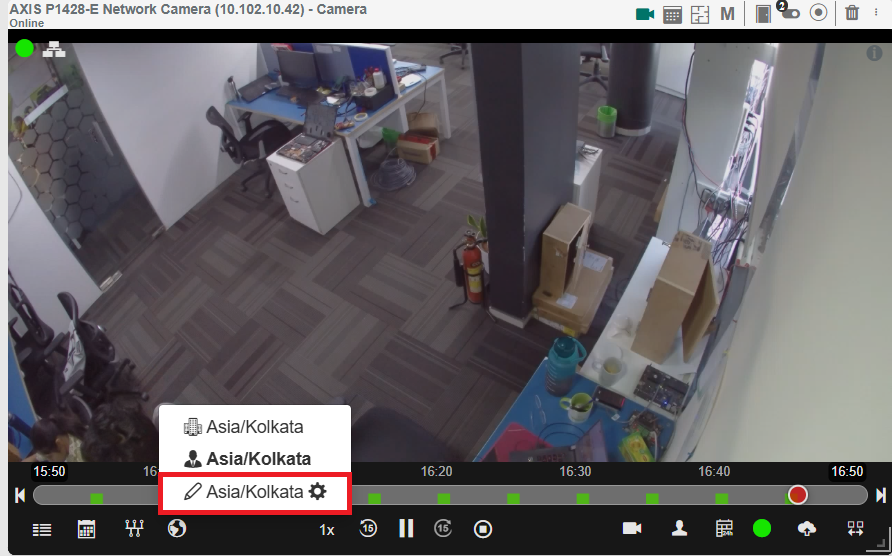
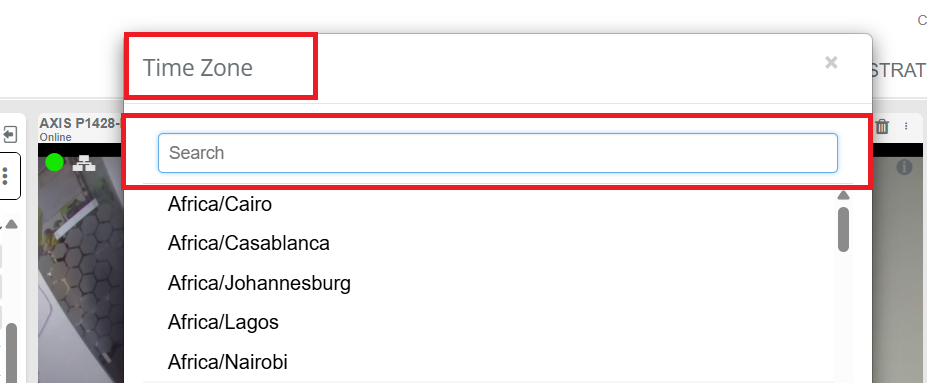
d. Timezone Search Enhancements
i. Added a search field within the Custom Timezone selection window for faster timezone lookup.
ii. Displayed a "No results found" message when no matching timezone entries exist.
iii. Ensured the selected timezone is accurately applied to the camera view after confirmation.
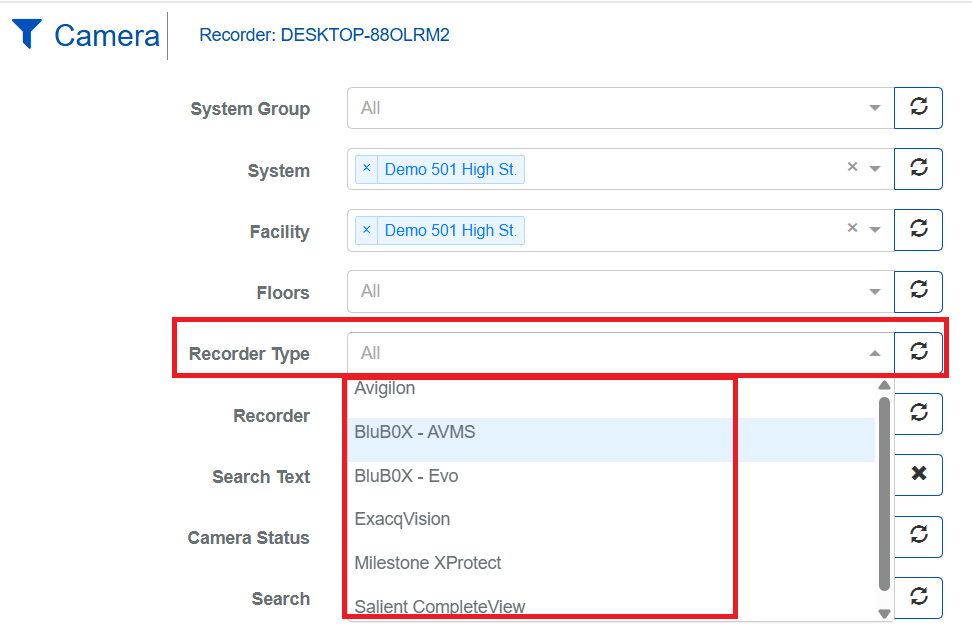
e. Recorder Type Filter
i. Added a new Recorder Type filter to the Camera View List page for easier filtering and camera management.
ii. Users can now quickly view cameras associated only with the selected recorder type.
Recorder Enhancements
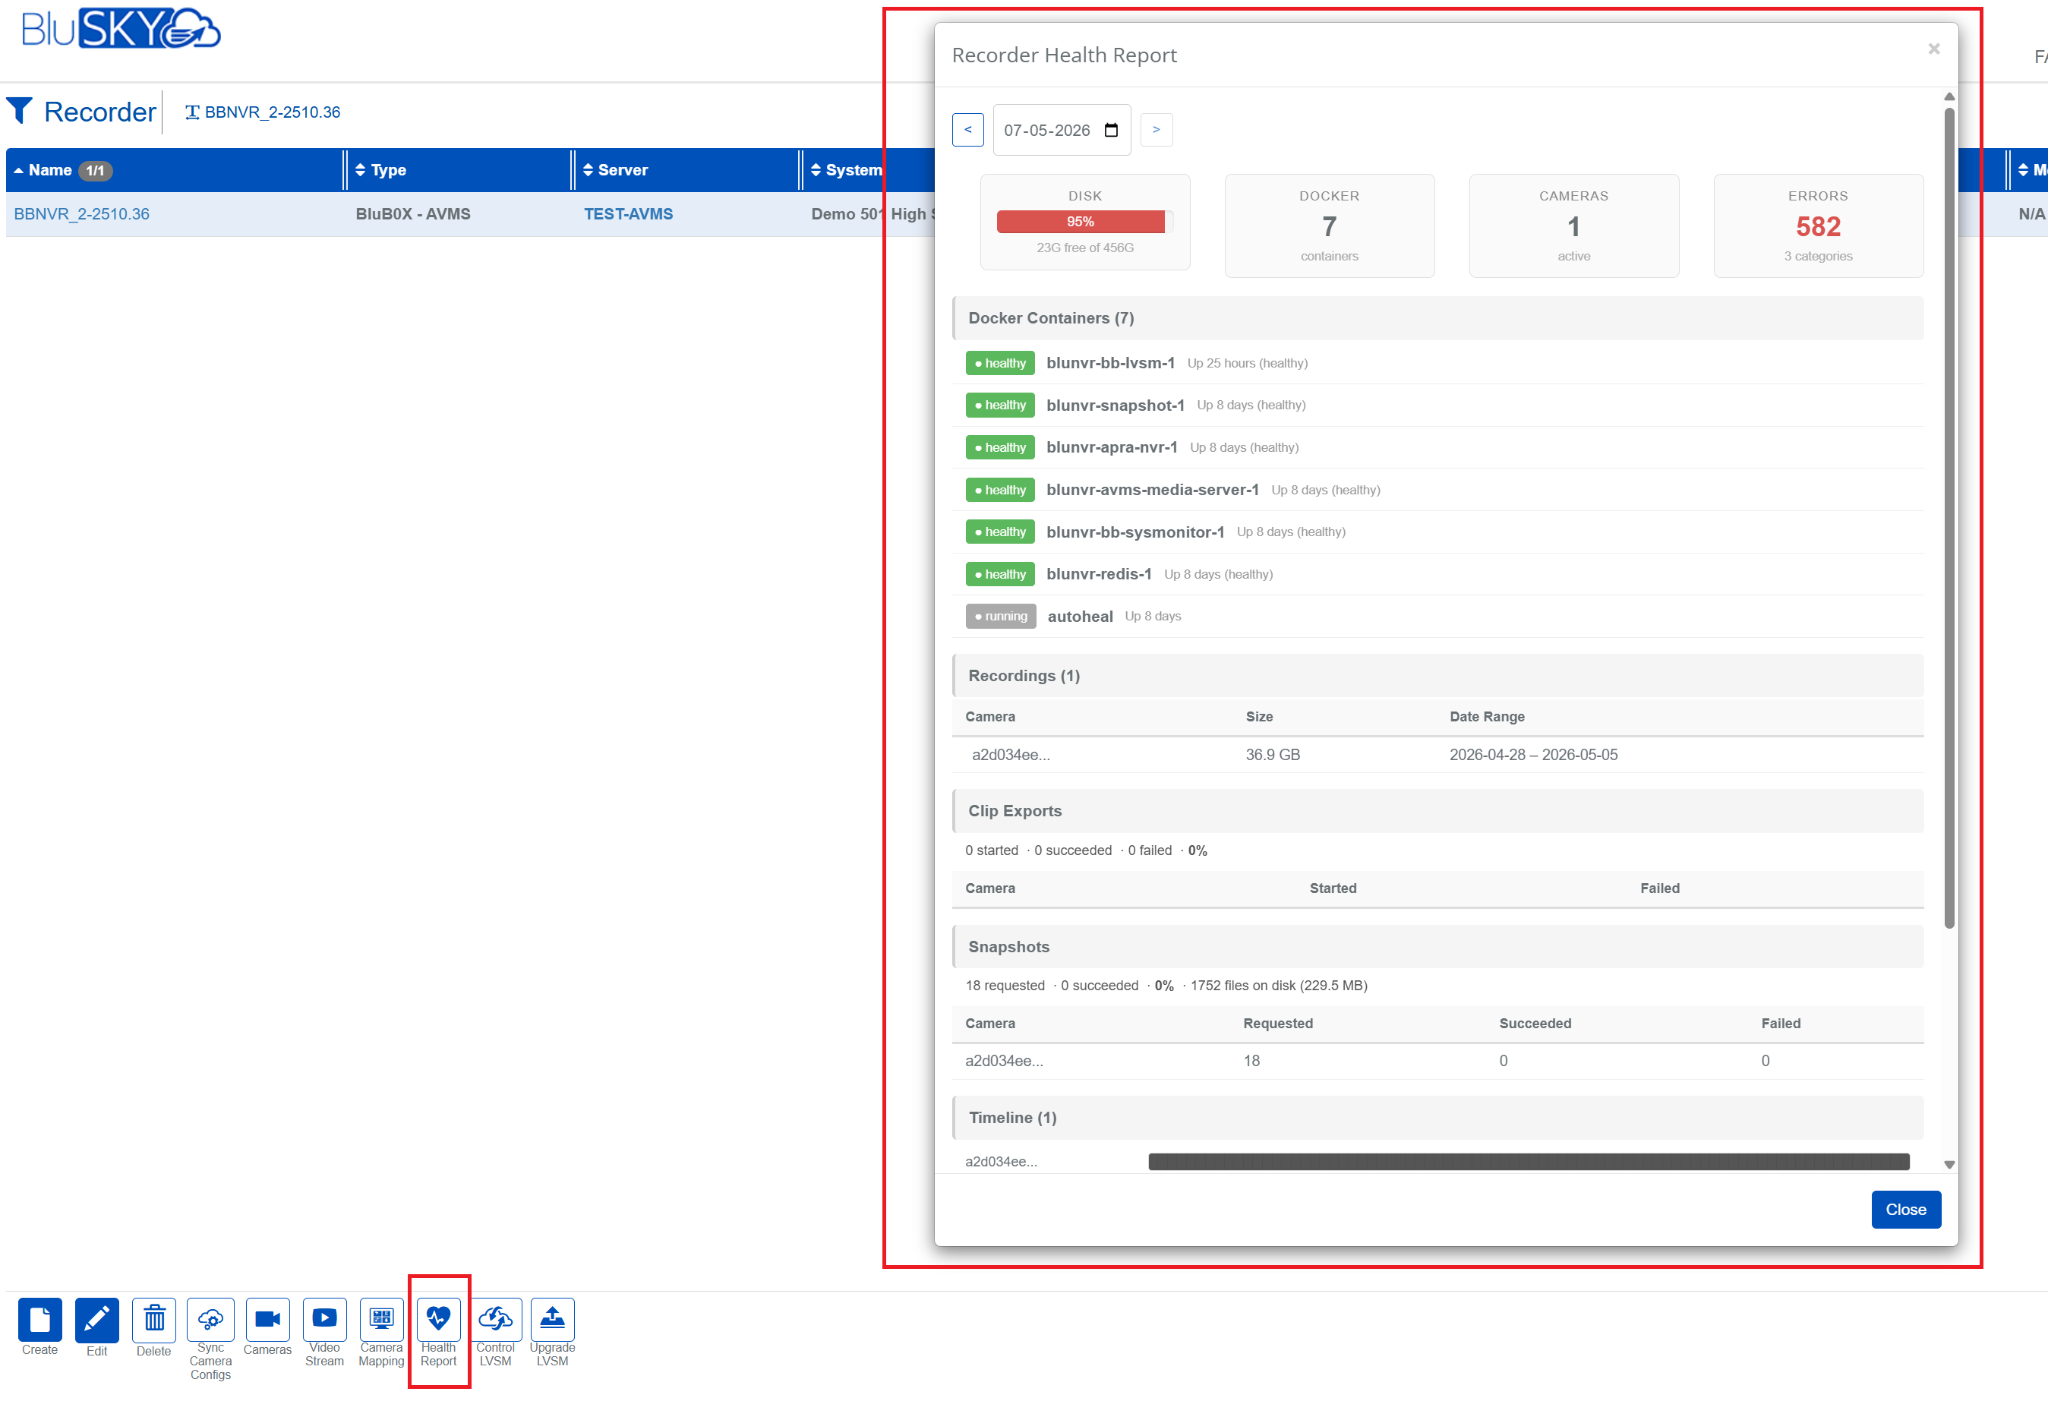
a. BBNVR Recorder Health Status Monitoring
i. Added a new Health Status section for BBNVR Recorders to provide visibility into recorder health and operational status.
ii. The nightly health report now includes:
- Disk usage
- Camera connectivity and status
- Recording gaps
- Additional recorder health metrics
iii. Added graceful handling for unavailable health information by displaying a "No health data available" message when required.
iv. This feature is available exclusively for BluB0X users using BBNVR recorders.
UI Language Options Update
- Removed Korean (KO) and Spanish (ES) from the available language options in the UI language selector.
AI Ticketing
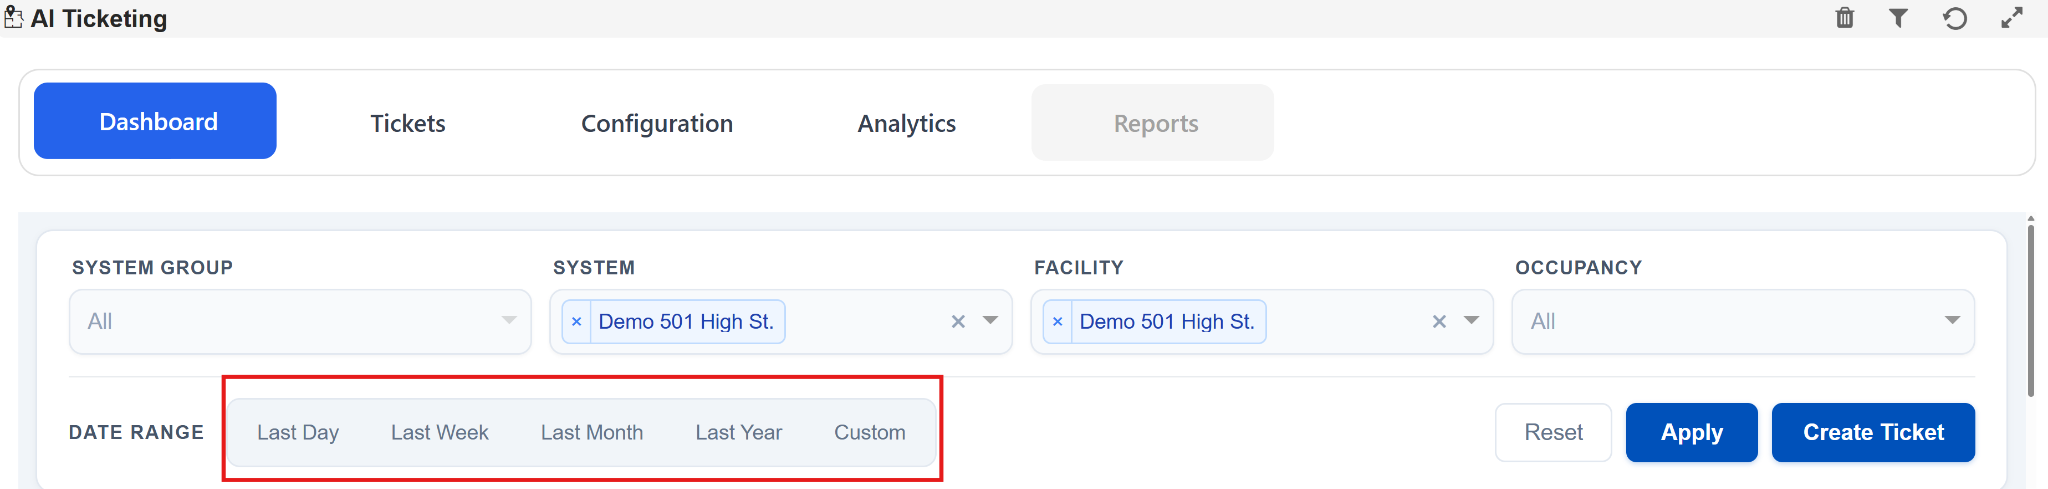
a. Dashboard Date Range Filter Enhancements
Enhanced the Dashboard filtering experience by improving the Date Range selection behavior and usability.
-
Added predefined Date Range filters:
- Last Day
- Last Week
- Last Month
- Last Year
- Custom
-
Improved dashboard usability with quick-access date filtering options.
-
Optimized filter interaction for faster dashboard data analysis.
-
Enhanced overall dashboard navigation and reporting experience.
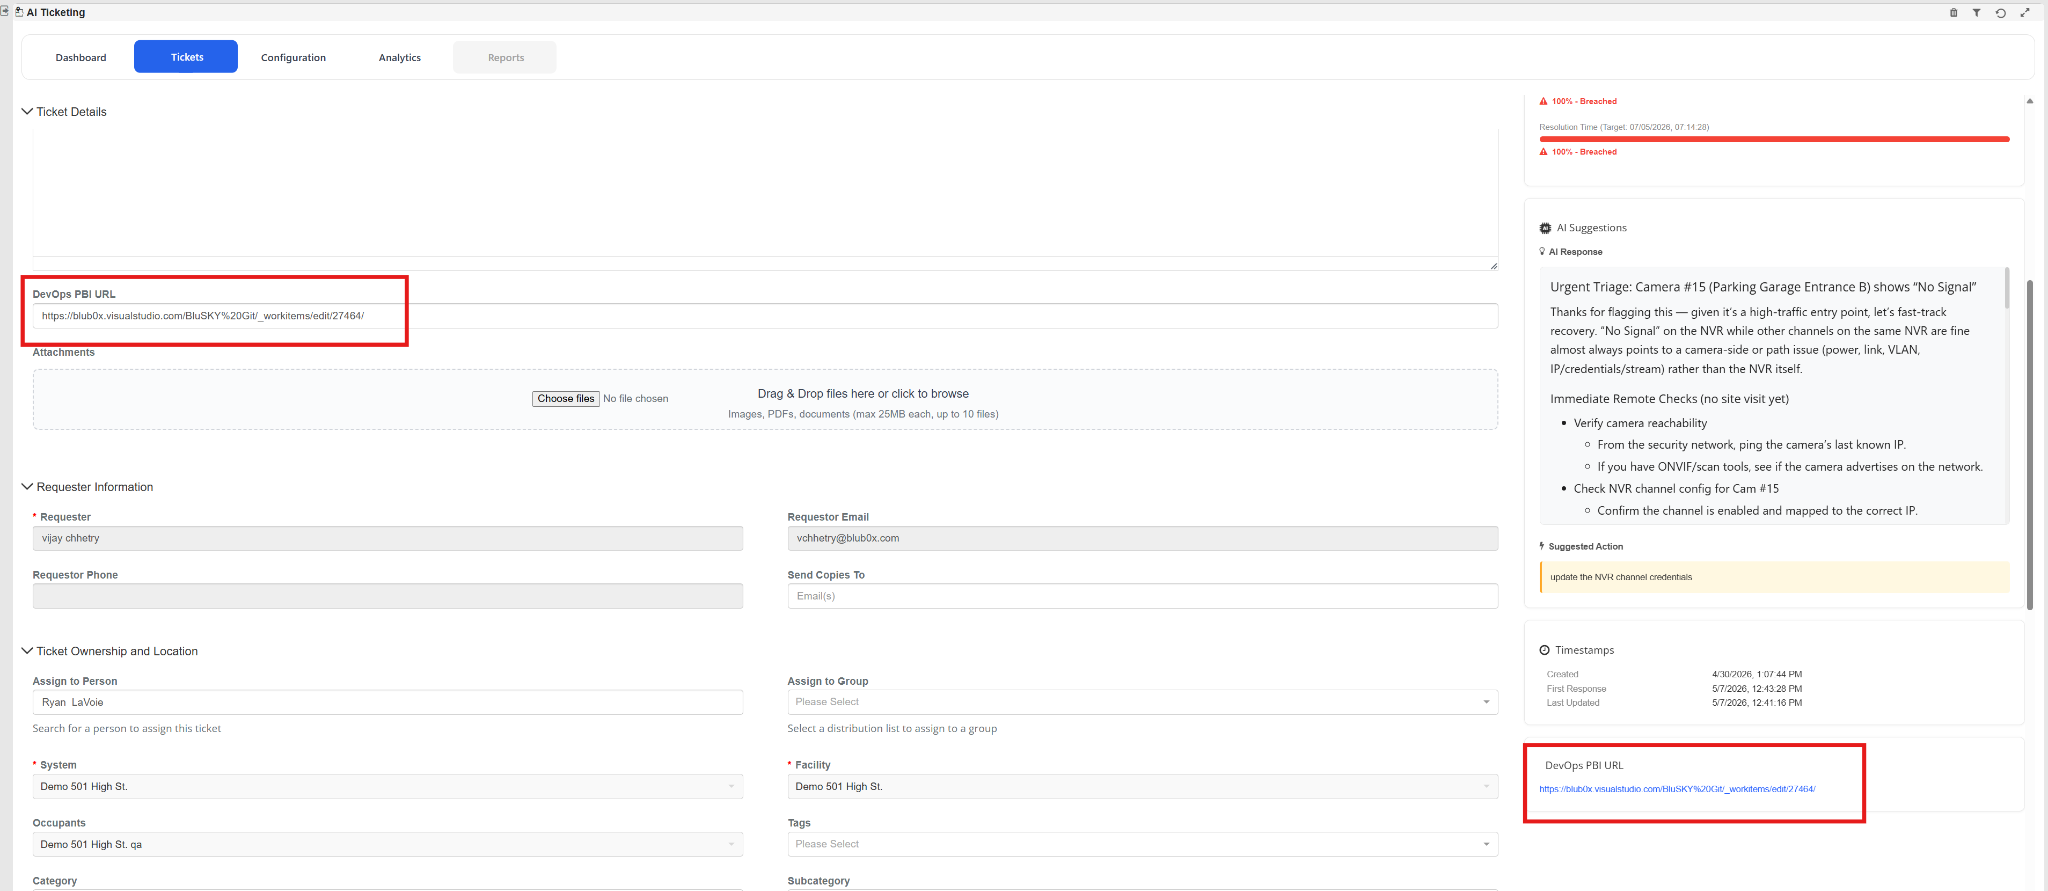
b. Ticket Details UI Improvements
Enhanced the Ticket Details page by improving the visibility and accessibility of the DevOps PBI URL section.
- Added dedicated DevOps PBI URL section within Ticket Details.
- Improved visibility of linked Azure DevOps work item references.
- Added quick-access navigation to associated DevOps PBI.
- Enhanced traceability between AI Ticketing and Azure DevOps items.
c. Permission Service Implementation
Introduced a new centralized Permission Service to enhance role-based access control within AI Ticketing.
-
Implemented granular permission management for:
- Ticket Configuration
- Ticket Administration
- Ticket Creation
- Ticket Creation for Others
-
Improved feature visibility and access control based on assigned permissions.
-
Enhanced permission consistency across ticketing workflows.
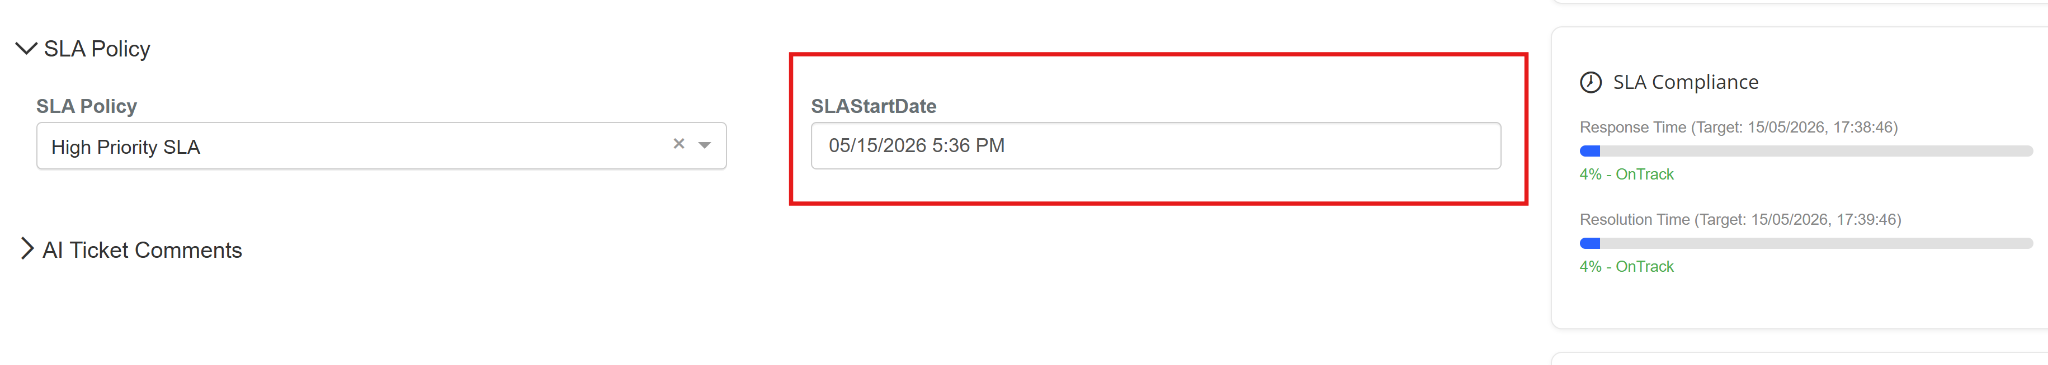
d. SLA Policy & Breach Calculation Enhancement
- Added SLA Policy mapping within Ticket Details.
- Introduced automatic SLA Start Date tracking.
- Implemented dynamic SLA Breach calculation based on SLA Start Date.
- Improved SLA visibility for response and resolution tracking.
- Enhanced SLA workflow integration with ticket priorities and categories.
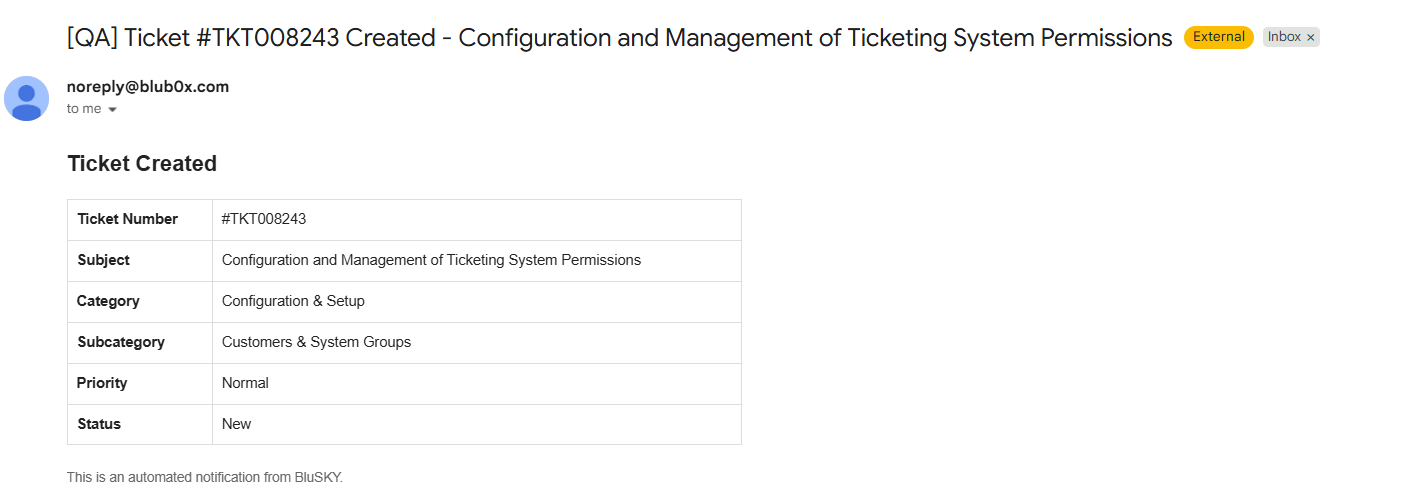
e. Ticket Creation Email Notification
Introduced automated email notifications when a new ticket is created in AI Ticketing.
-
Automatic email notification sent upon ticket creation.
-
Email includes:
- Ticket Number
- Subject
- Category
- Subcategory
- Priority
- Ticket Status
-
Improved visibility and tracking for newly created tickets.
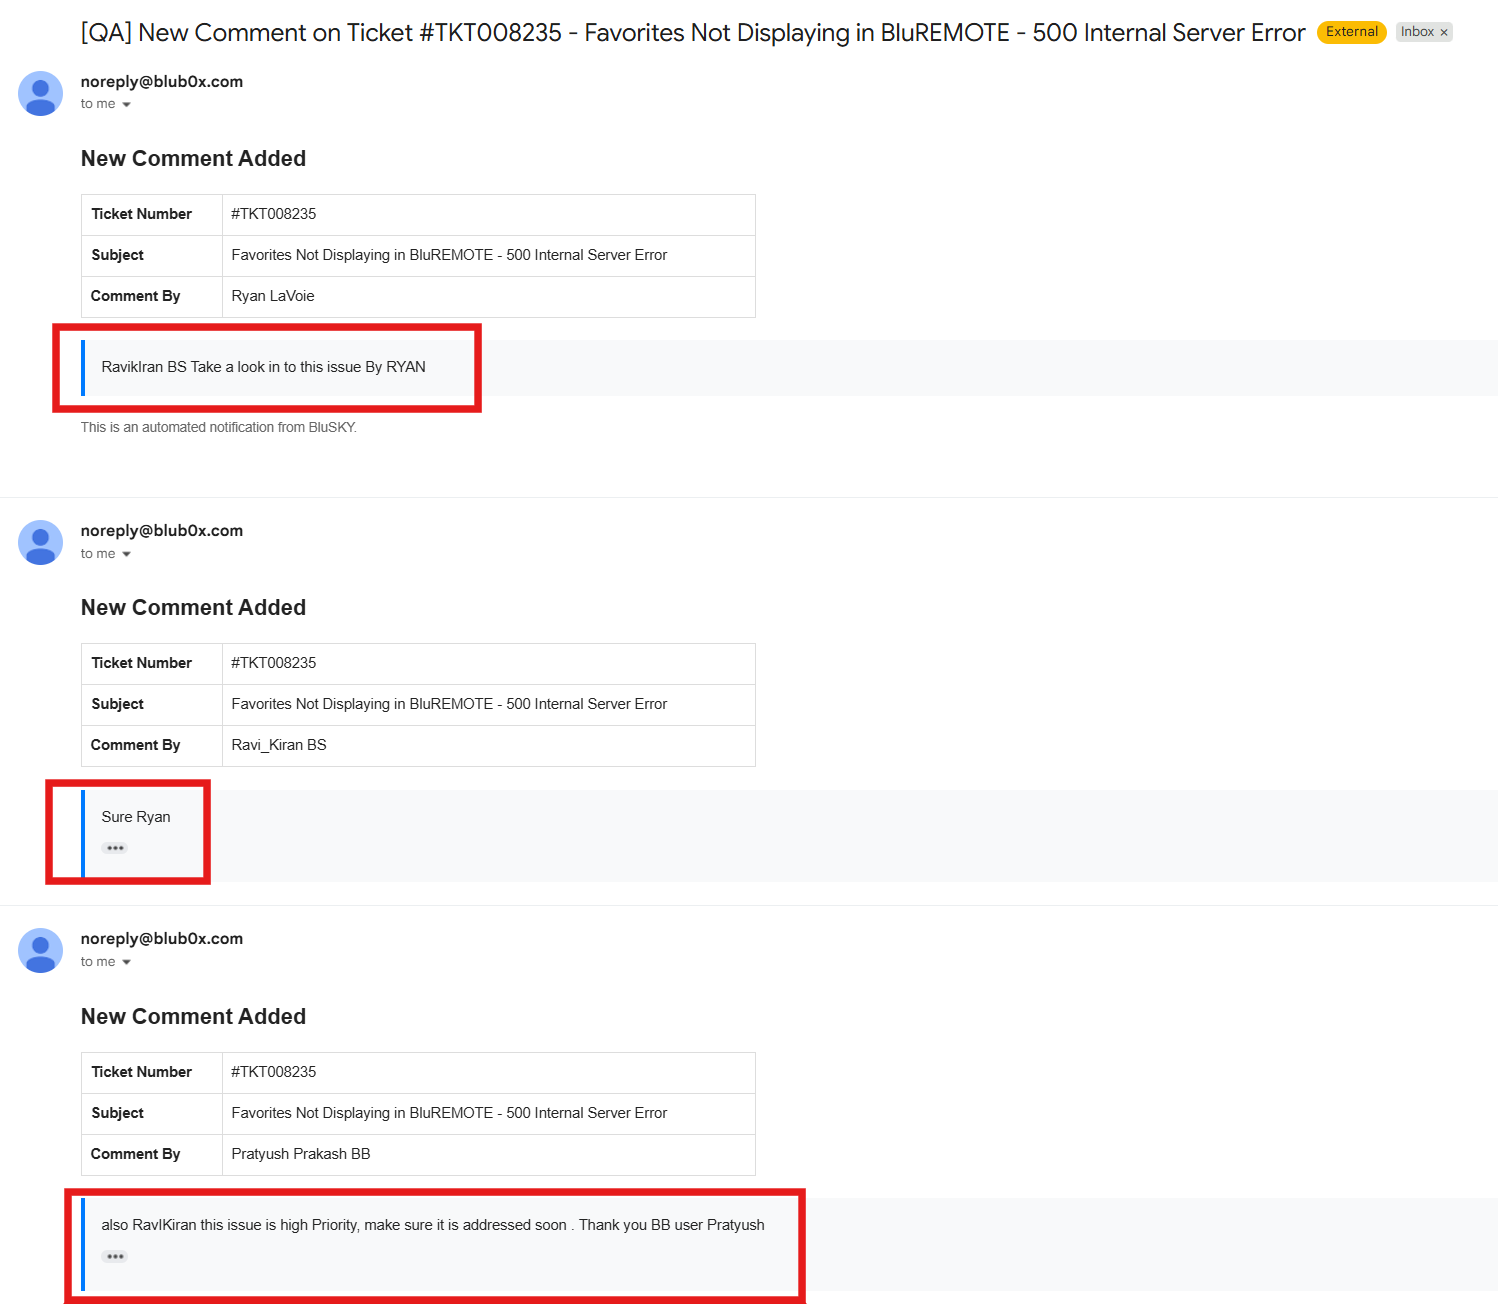
f. Ticket Comment Email Notifications
Introduced automated email notifications for ticket comments to improve communication and collaboration between ticket stakeholders.
-
Automatic email notification sent when a new comment is added to a ticket.
-
Email includes:
- Ticket Number
- Ticket Subject
- Commented By
- Comment Message
-
Notifications are sent for ticket conversation updates between stakeholders.
-
Improved visibility of ticket discussions and ongoing updates.
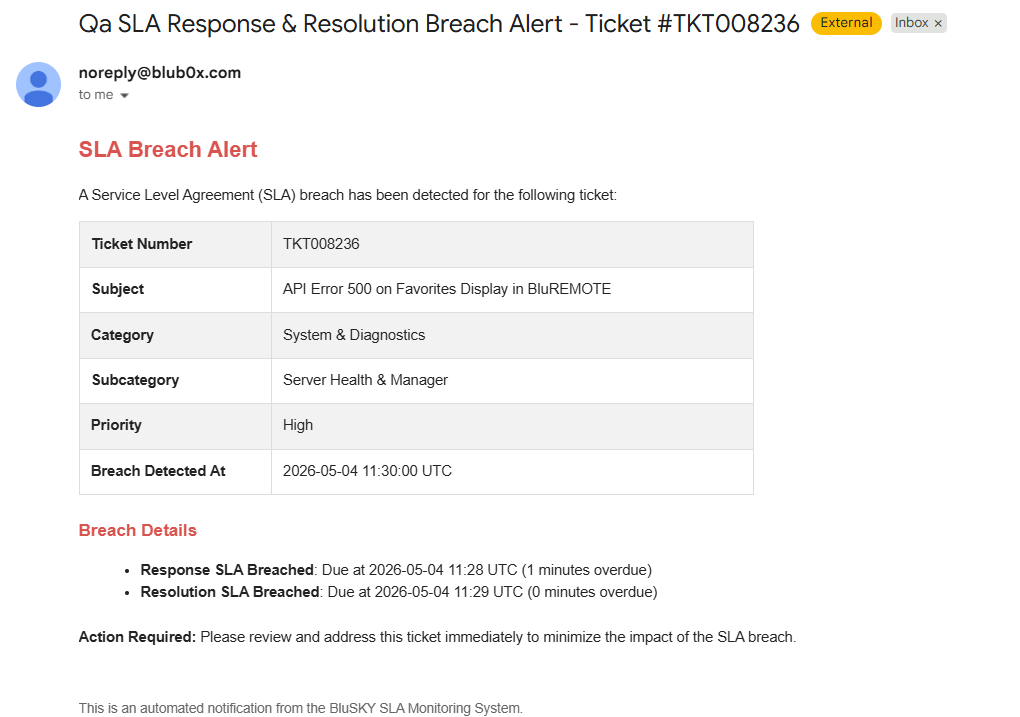
g. SLA Breach Email Notifications
Introduced automated SLA Breach email notifications to improve visibility and response handling for breached tickets.
-
SLA Breach email notifications are now sent to:
- Ticket Creator
- Ticket Assignee
-
Added detailed breach information including:
- Response SLA Breach
- Resolution SLA Breach
- Breach detection timestamp
-
Added automated alerting for critical SLA violations.
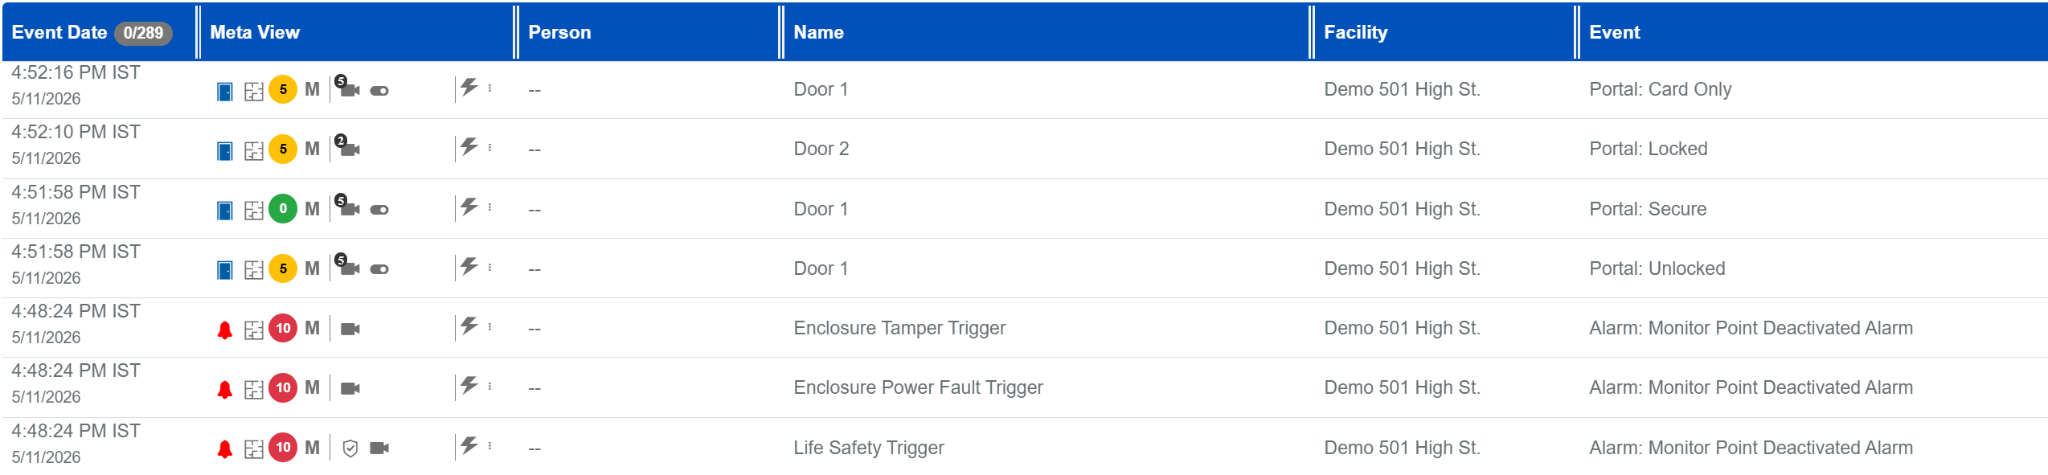
Alarms & Events: Enhanced Risk Score Visibility Across Events and Alarms
a. Risk assessment visibility has been improved across BluSKY to provide users with faster and more actionable security insights. The system now displays the Calculated Risk Score, when available, across Alarms, Event History, Realtime Events & Device control pages. This score dynamically reflects detected activity patterns and potential threats, replacing the static Baseline Risk Score view.
b. Additional hover details are now available to provide context behind elevated risk levels, including the contributing activities and an explanation of the assigned risk category. Risk indicators and color coding have also been standardized across all updated pages, making it easier to quickly identify and prioritize high-risk events.
Analytics: New Analytics for Security Insights
Several new analytics visualizations have been added to provide deeper operational and security visibility.
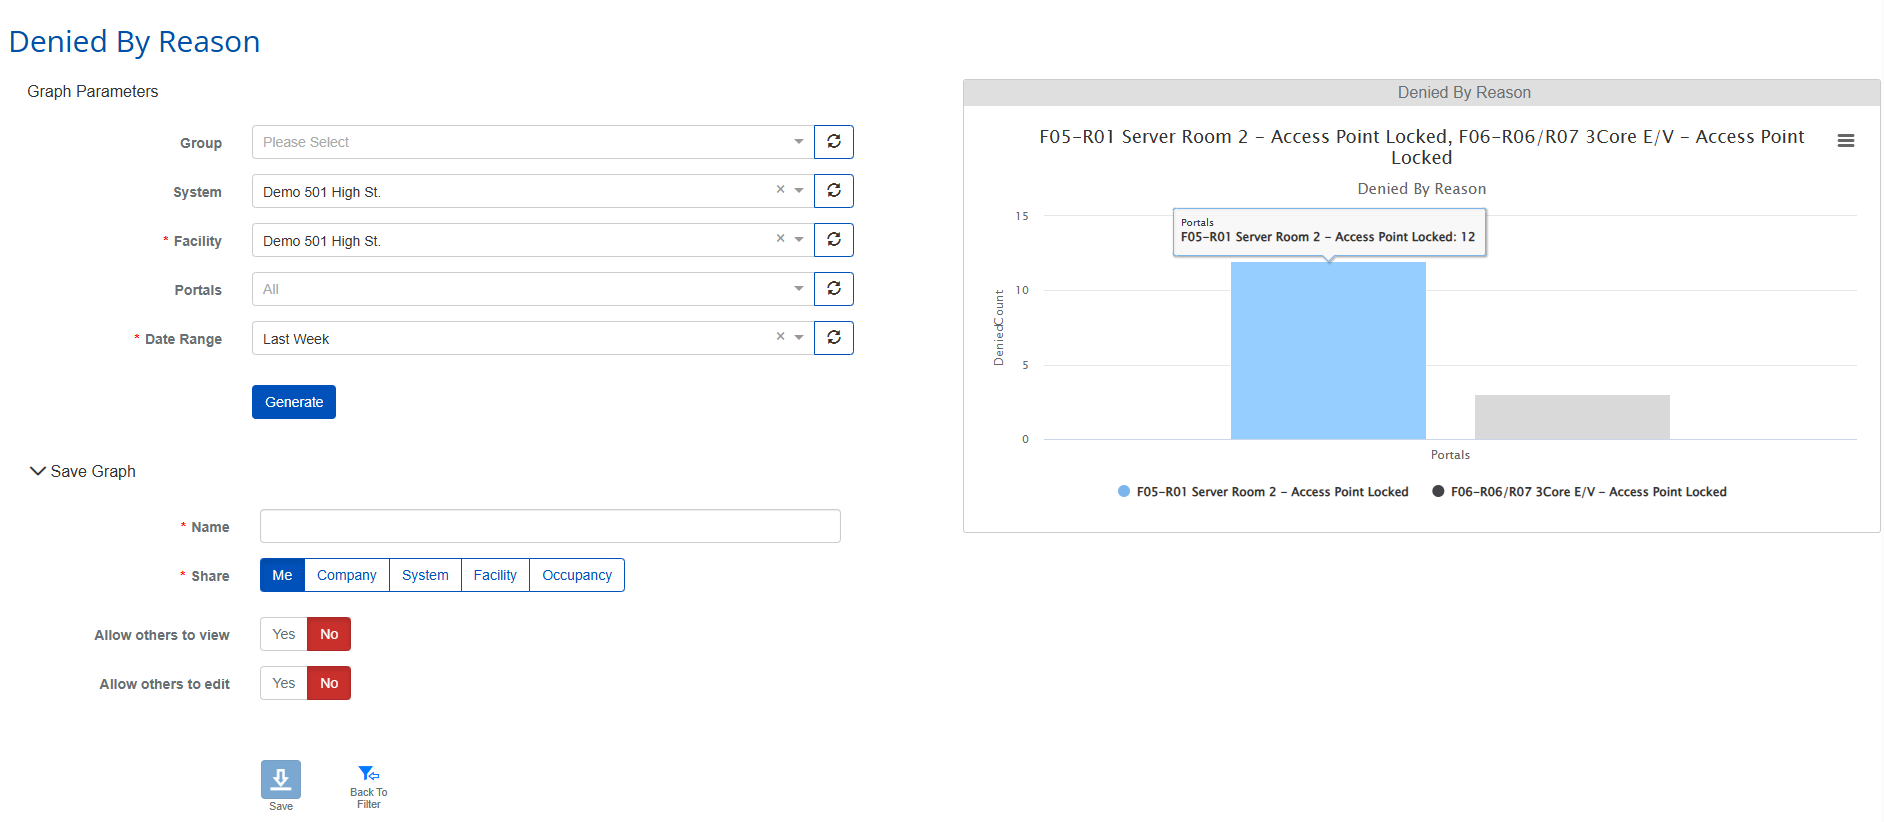
a. Denied By Reason
Provides a breakdown of Access Denied events by denial reason, such as invalid credentials, expired cards, access level restrictions, schedule violations, and anti-passback events. This helps administrators quickly identify common access issues and take corrective action.
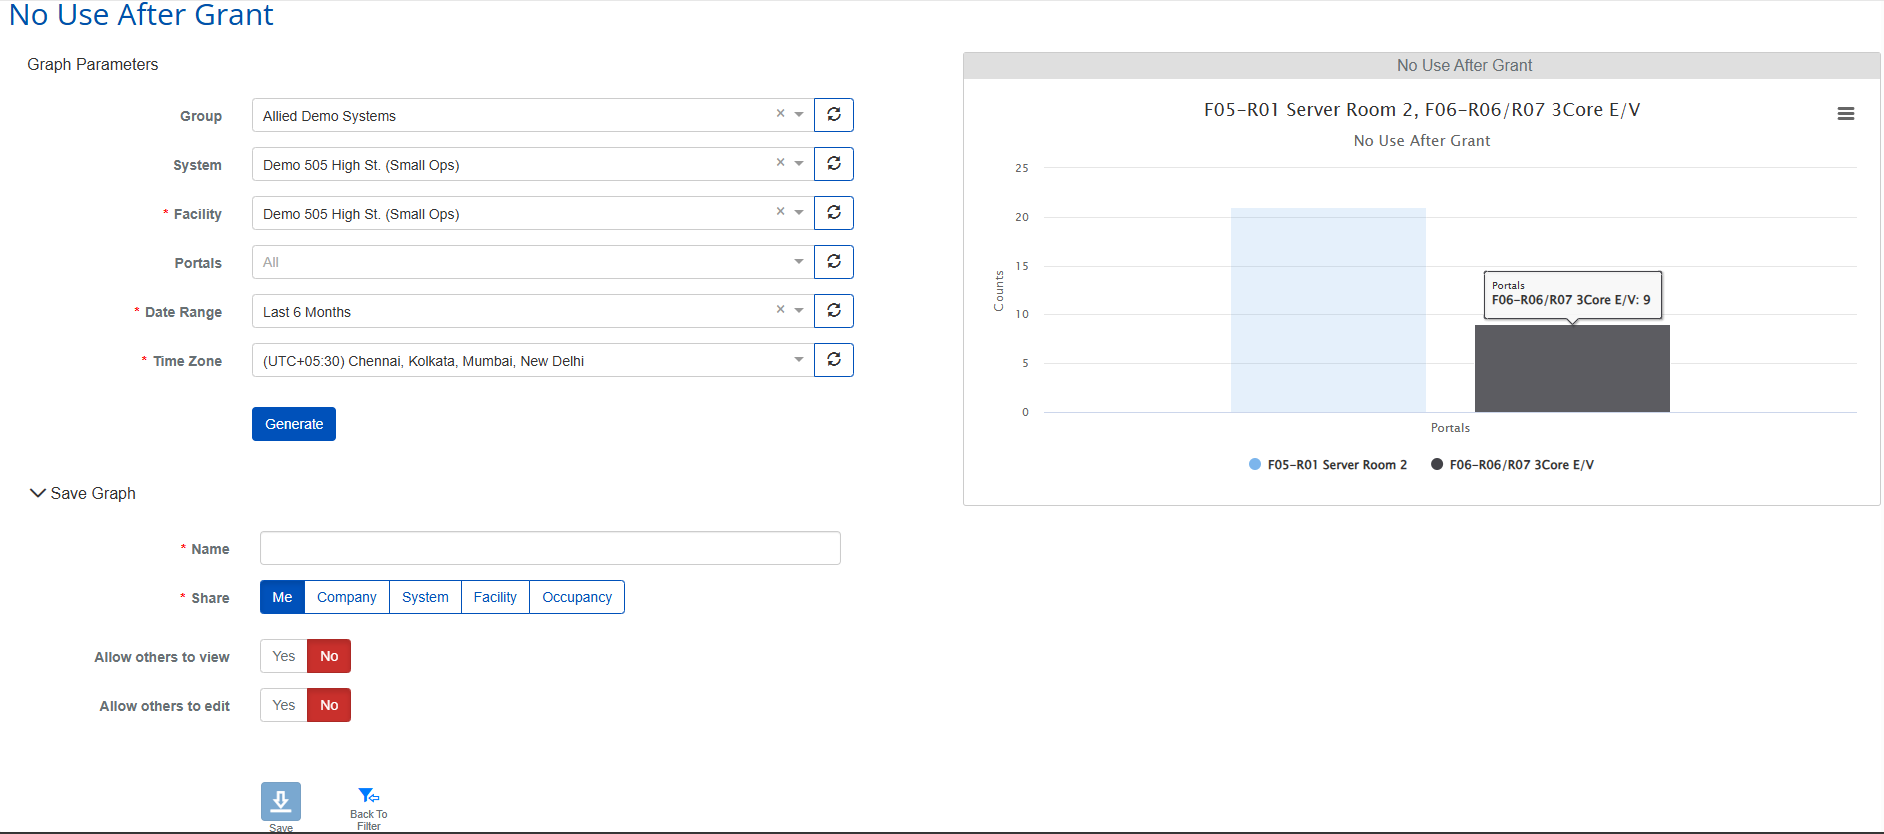
b. No Use After Grant
Highlights situations where access is granted but no corresponding door activity occurs within the expected timeframe. This can help identify potential tailgating incidents, unused credentials, abnormal user behavior, or hardware-related issues.
c. Burst Held Open
Detects unusual spikes in Held Open events within short time windows and ranks portals based on burst intensity. This provides quicker visibility into doors experiencing abnormal or potentially risky activity patterns.
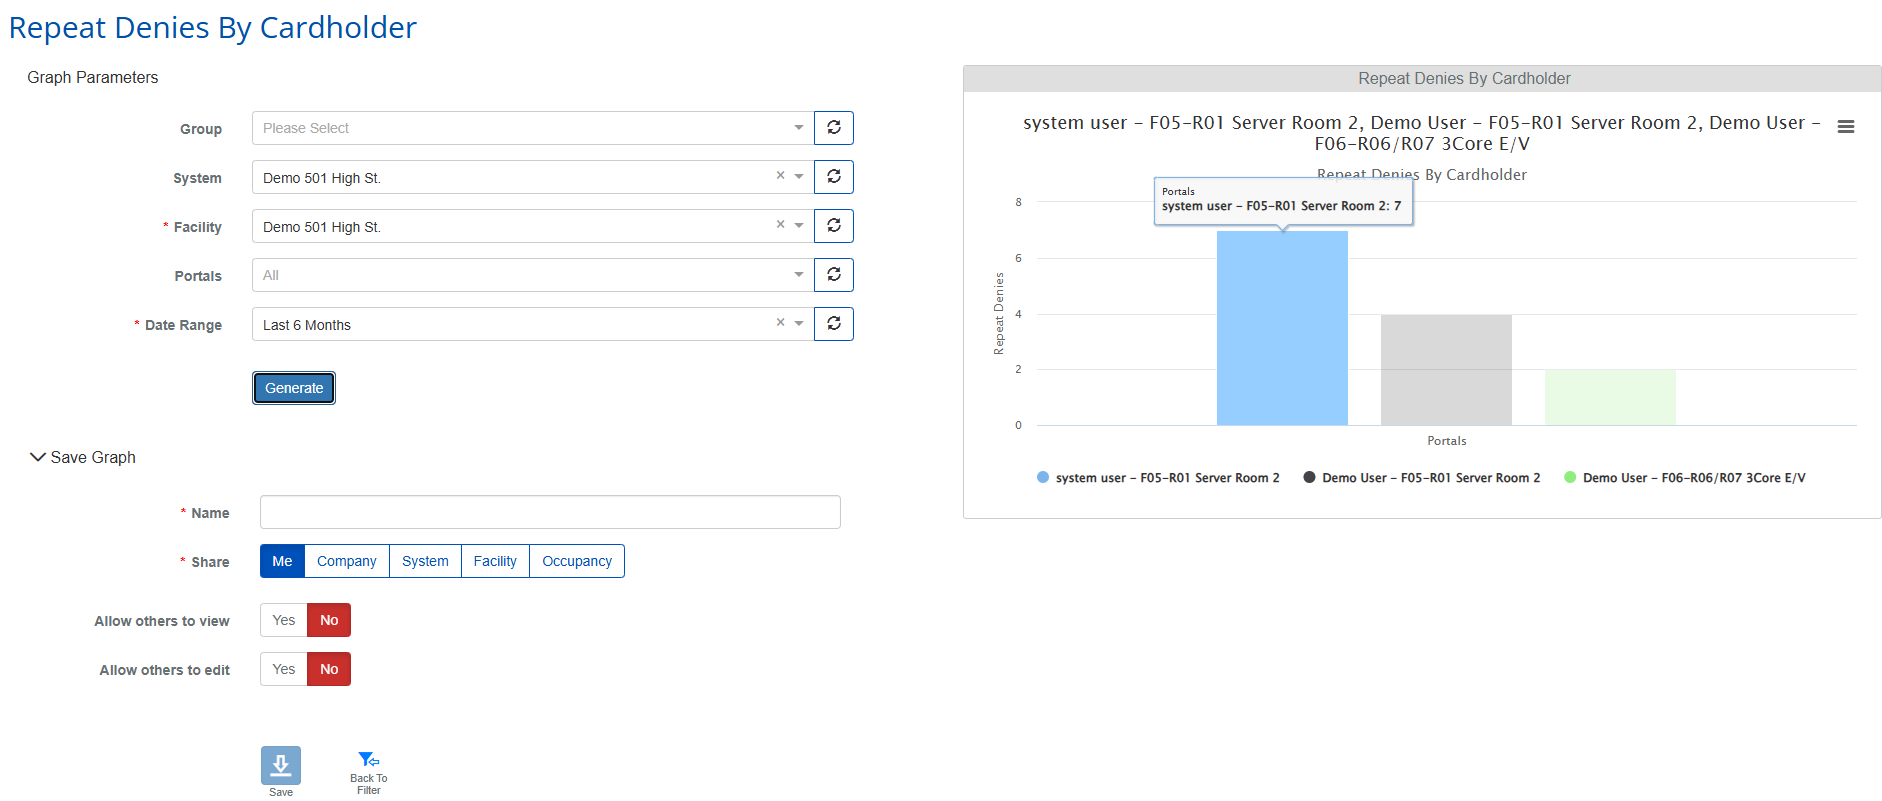
d. Repeat Denies By Cardholder
Identifies cardholders with repeated denied access attempts over a selected period, helping security teams investigate potential credential misuse, configuration issues, or suspicious behavior patterns.
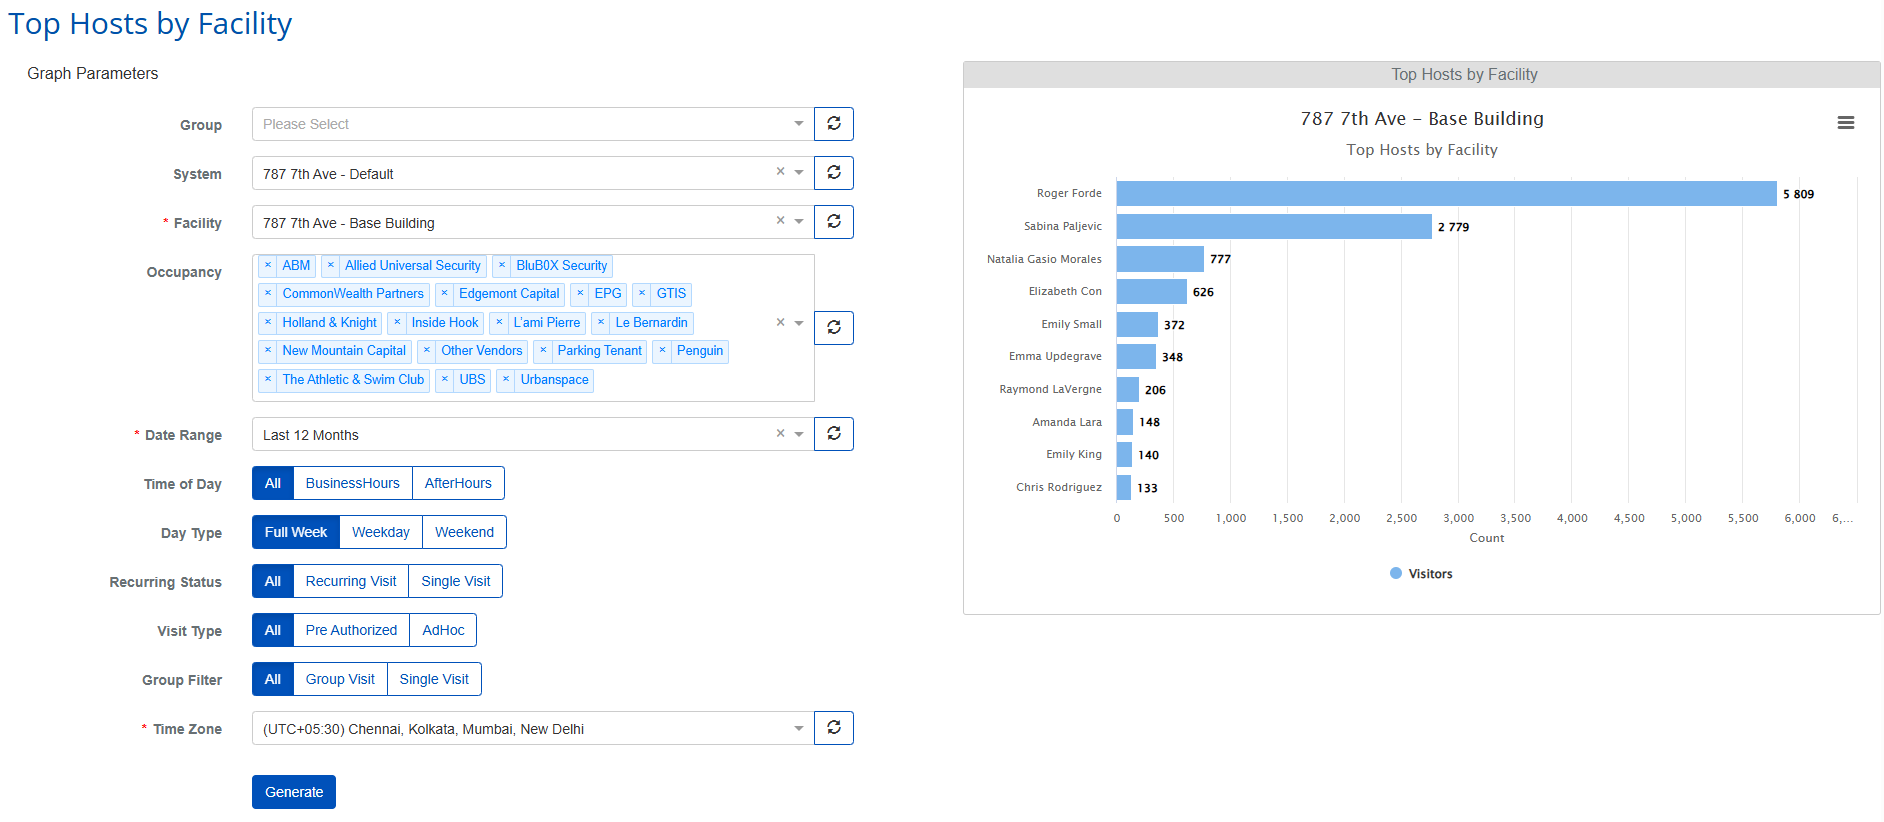
e. Top Hosts By Facility
Displays the top hosts generating visitor traffic within a facility, with support for advanced filtering such as occupancy, visit type, recurring visits, and time-based trends.
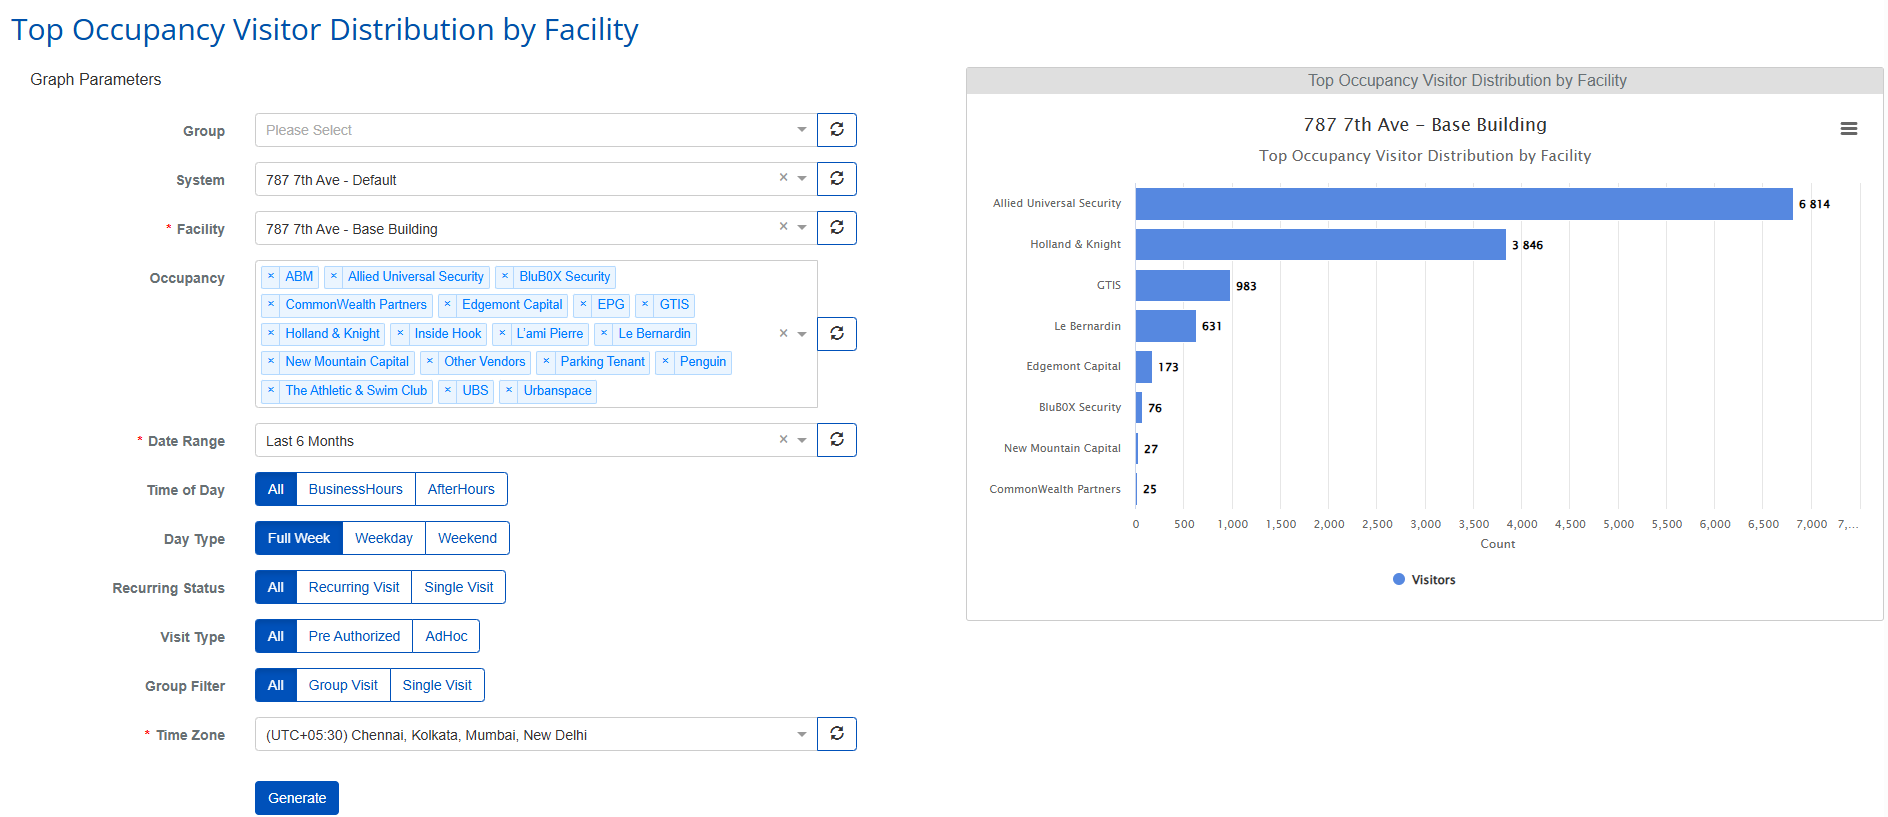
f. Top Occupancy Visitor Distribution By Facility
Provides insight into which occupancies or tenants are generating the highest visitor volumes, helping facility managers better understand visitor distribution and traffic patterns.
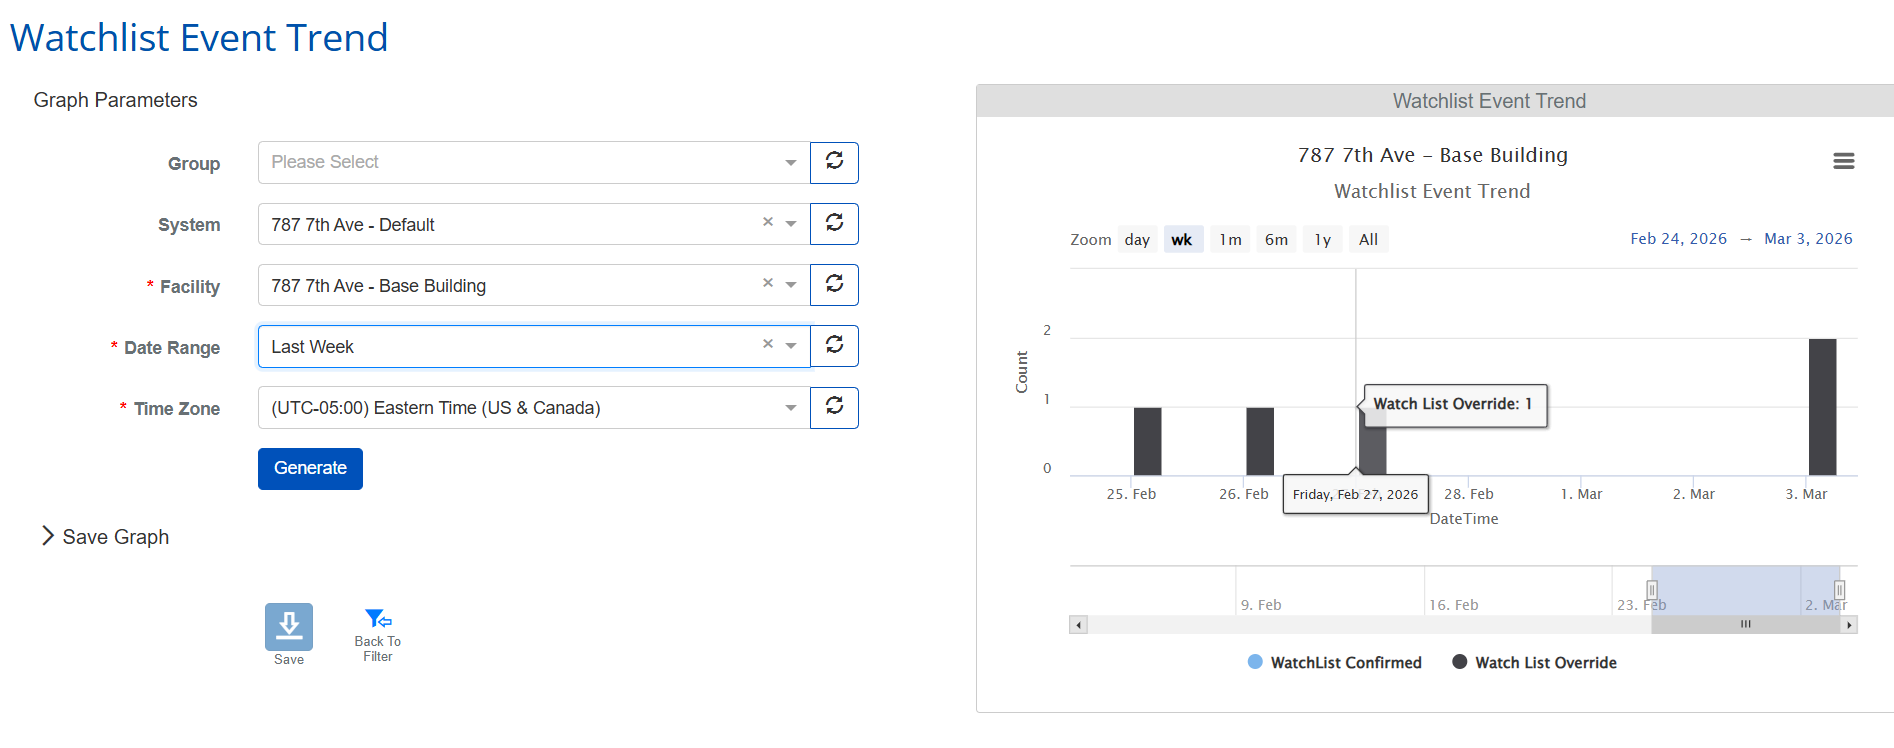
g. Watchlist Event Trend
Adds trend analysis for watchlist activity, including confirmed matches and overrides over time, allowing security operators to monitor patterns, identify anomalies, and improve incident response visibility.
LogBook Summary
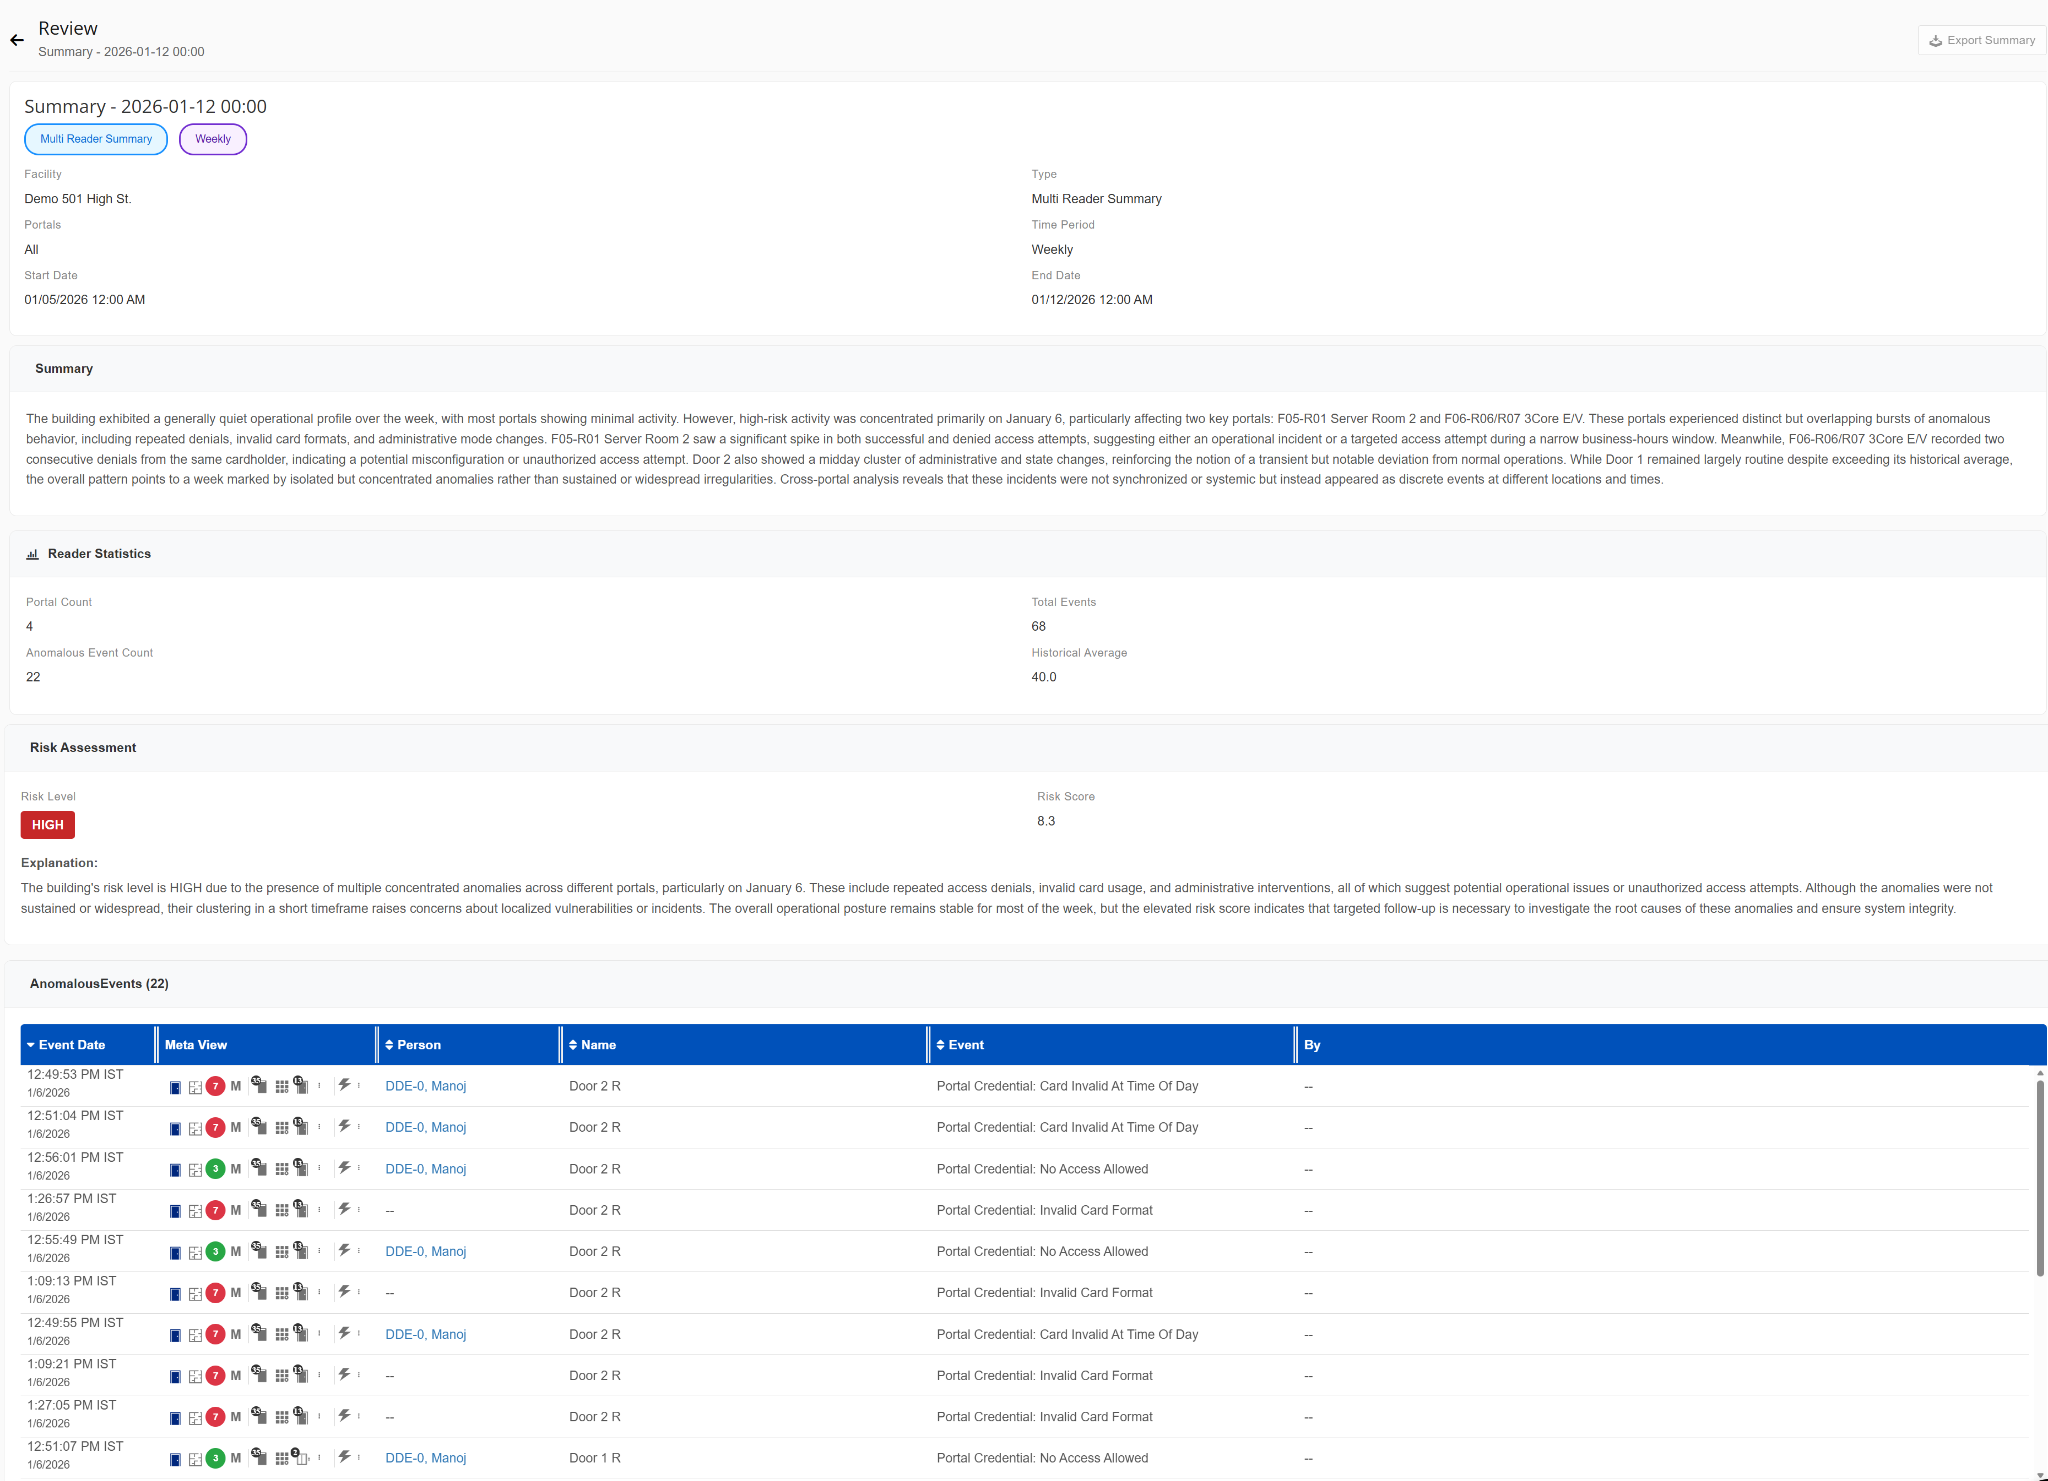
a. New Multi Reader Log Book Summary
i. A new AI-powered "Multi Reader Summary" Log Book Summary type has been added to provide intelligent summaries of reader activity across multiple time ranges including hourly, daily, weekly, monthly, quarterly, and yearly views.
ii. The summary consolidates reader activity into an easy-to-understand operational overview and includes:
- Reader statistics such as portal count, total events, anomalous event counts, and historical averages.
- AI-generated risk assessments with calculated risk scores and explanations.
- Identification and summarization of anomalous access activity across readers.
- Detailed anomalous event listings for faster investigation and incident review.
iii. This enhancement helps operators quickly identify unusual behavior patterns, operational anomalies, and potential security concerns without manually reviewing large volumes of events.
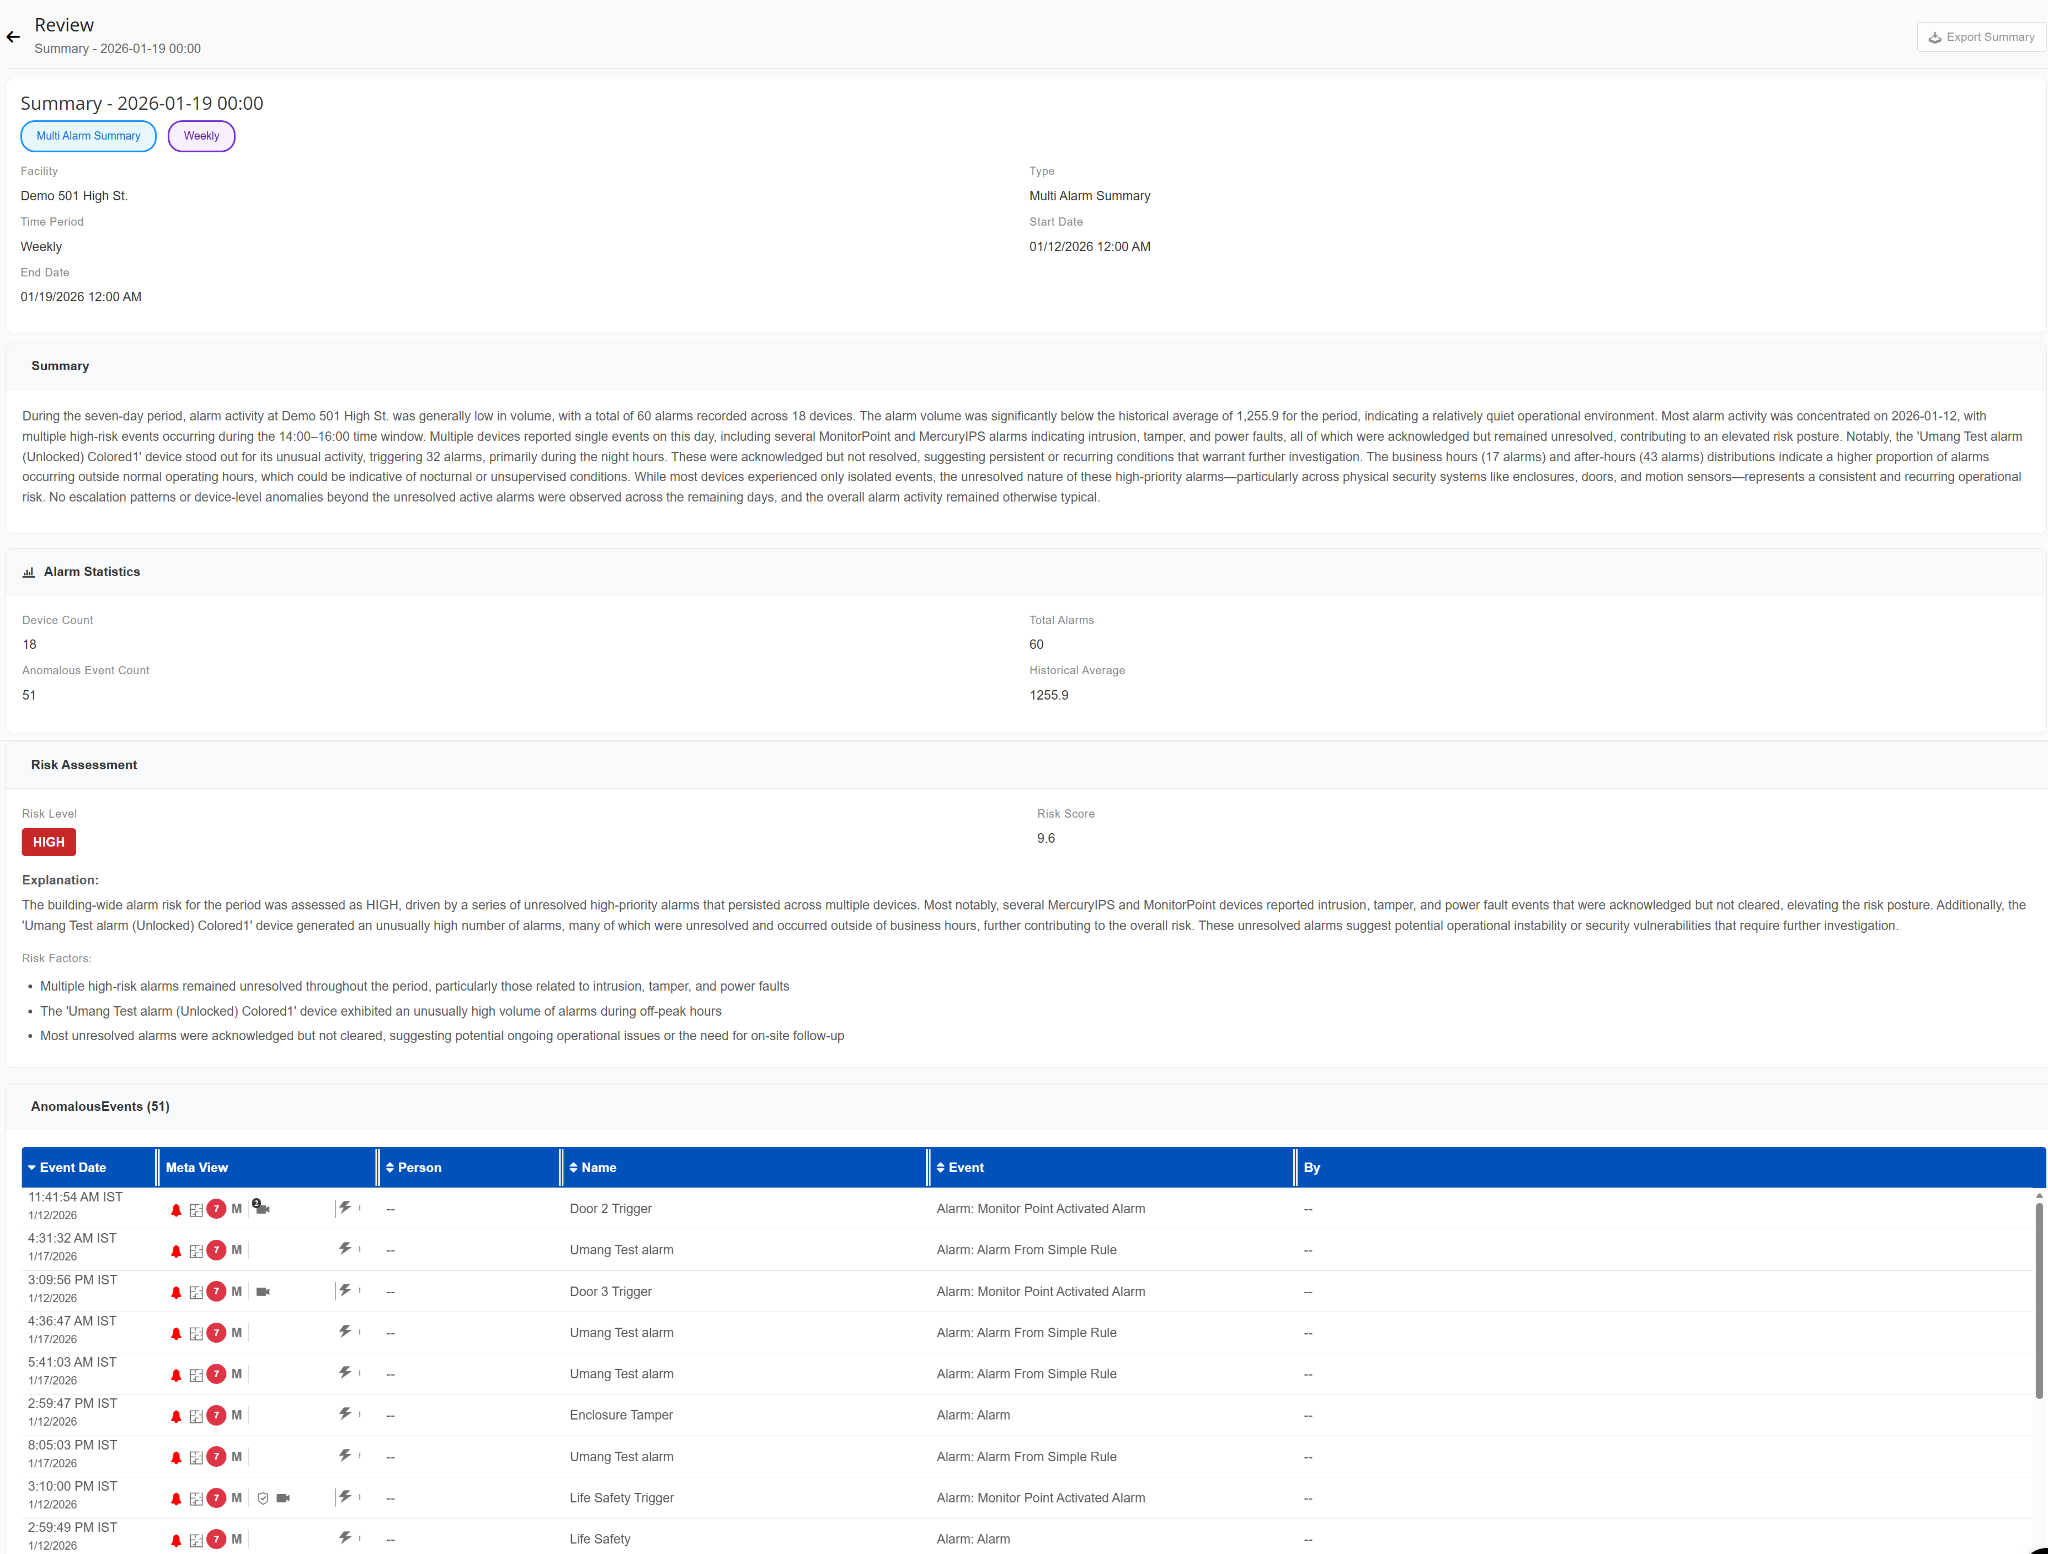
b. New Multi Alarm Log Book Summary
i. A new "Multi Alarm Summary" Log Book Summary type has been introduced to provide AI-generated summaries of alarm activity across multiple devices and time periods.
ii. The summary includes:
- Consolidated alarm activity analysis across selected timelines.
- Alarm statistics including device counts, total alarms, anomalous event counts, and historical averages.
- AI-generated risk assessments with risk levels, calculated scores, and contextual explanations.
- Identification of unresolved or abnormal alarm activity patterns.
- Detailed anomalous event listings to support investigation workflows.
iii. This feature enables operators to quickly understand overall alarm posture, detect operational risks, and prioritize follow-up actions more efficiently.
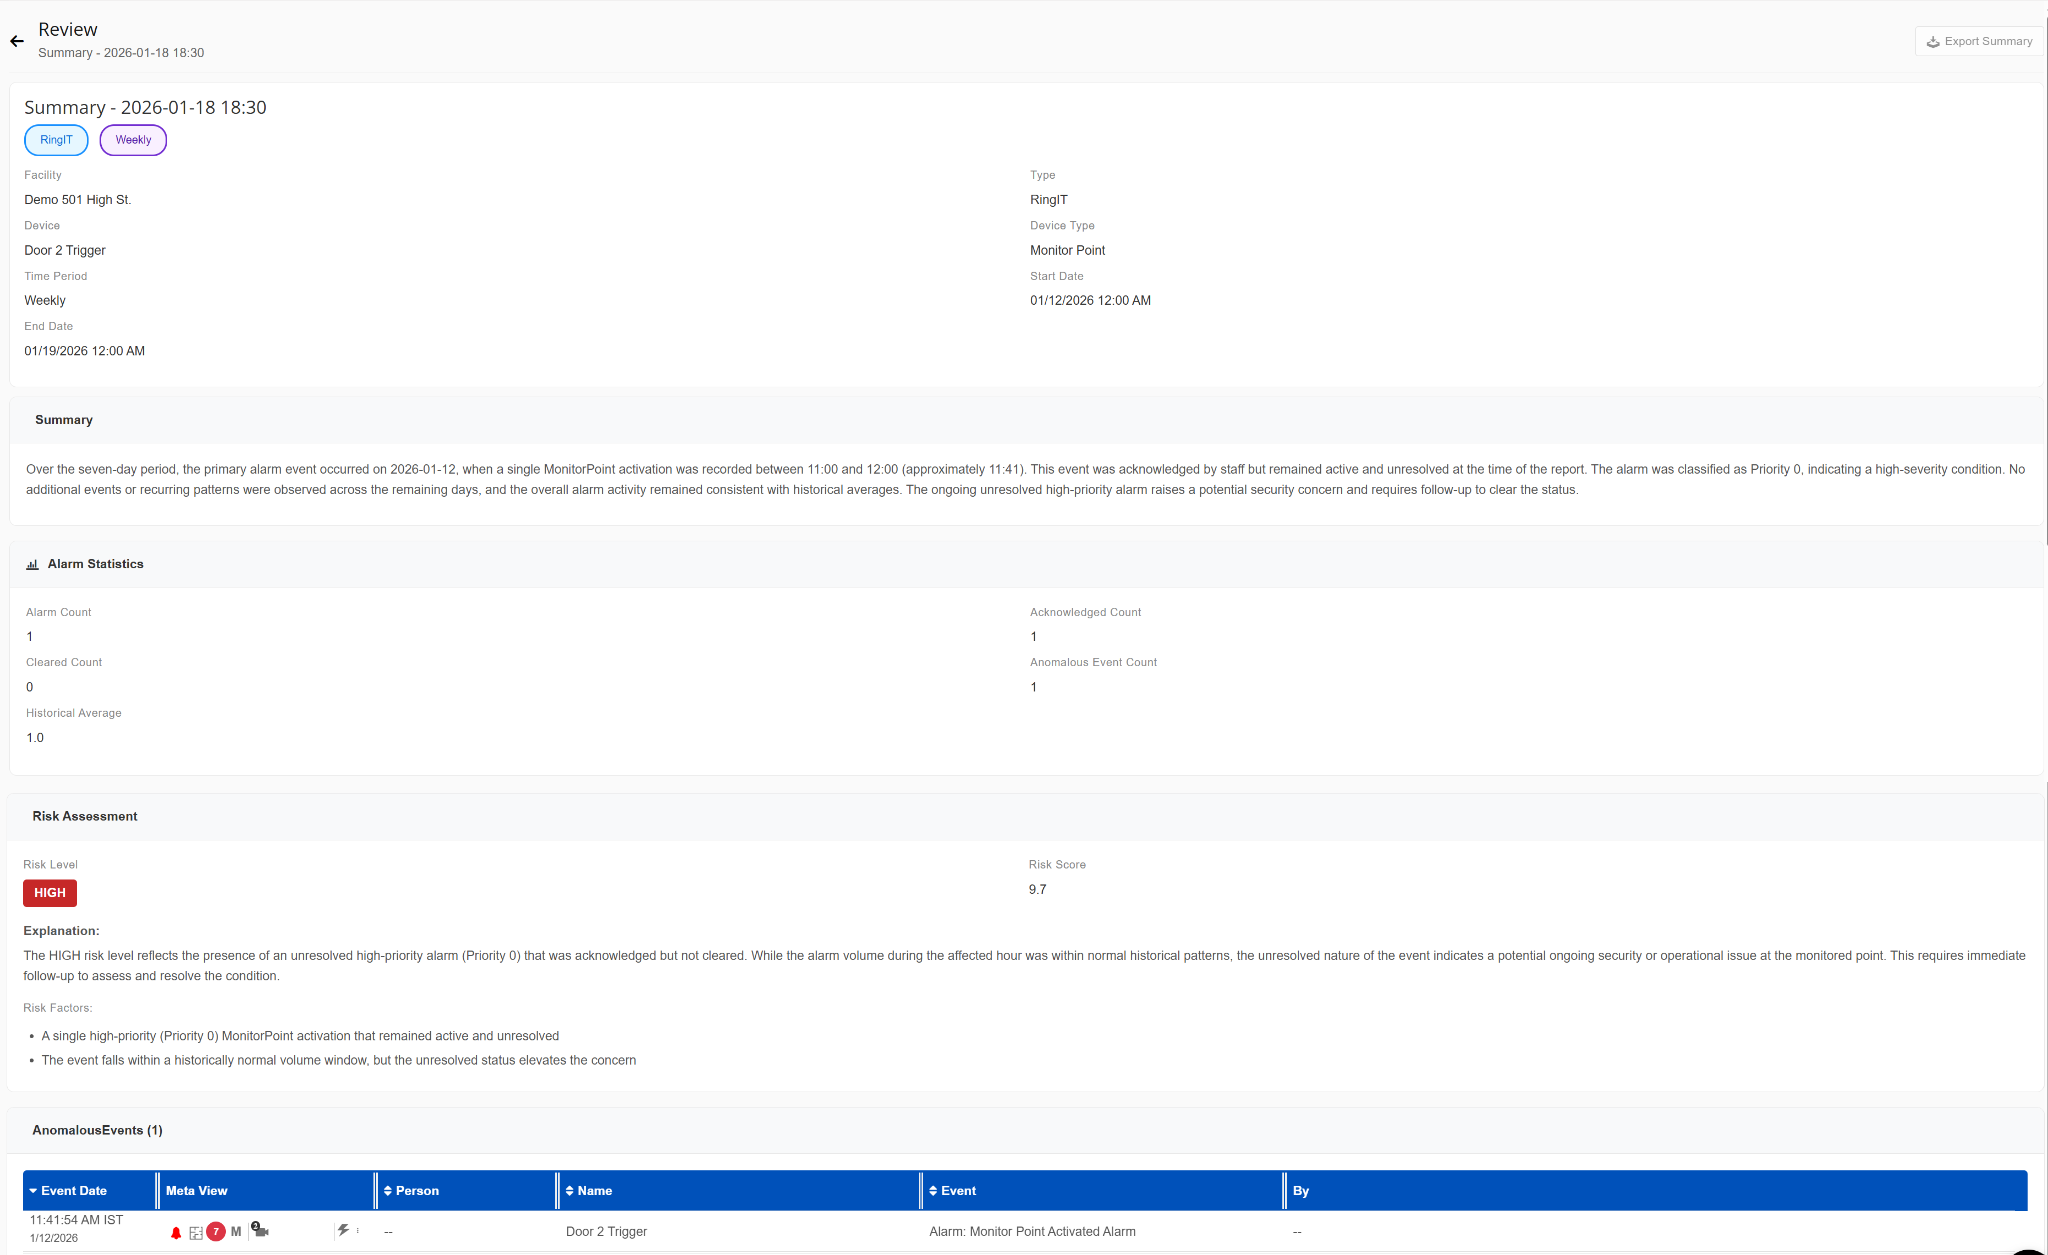
c. New Ring IT Log Book Summary
i. Added a dedicated "Ring IT" Log Book Summary type that provides AI-generated summaries for alarm activity related to individual devices.
ii. The summary includes:
- Alarm statistics such as total alarms, acknowledged alarms, cleared alarms, anomalous event counts, and historical averages.
- AI-generated risk assessments with calculated risk scores and contextual explanations.
- Identification and listing of anomalous alarm activity for the selected device.
iii. This enhancement improves visibility into device-level alarm behavior and supports faster troubleshooting and incident analysis.