Monitoring Points
BluSKY Workspace
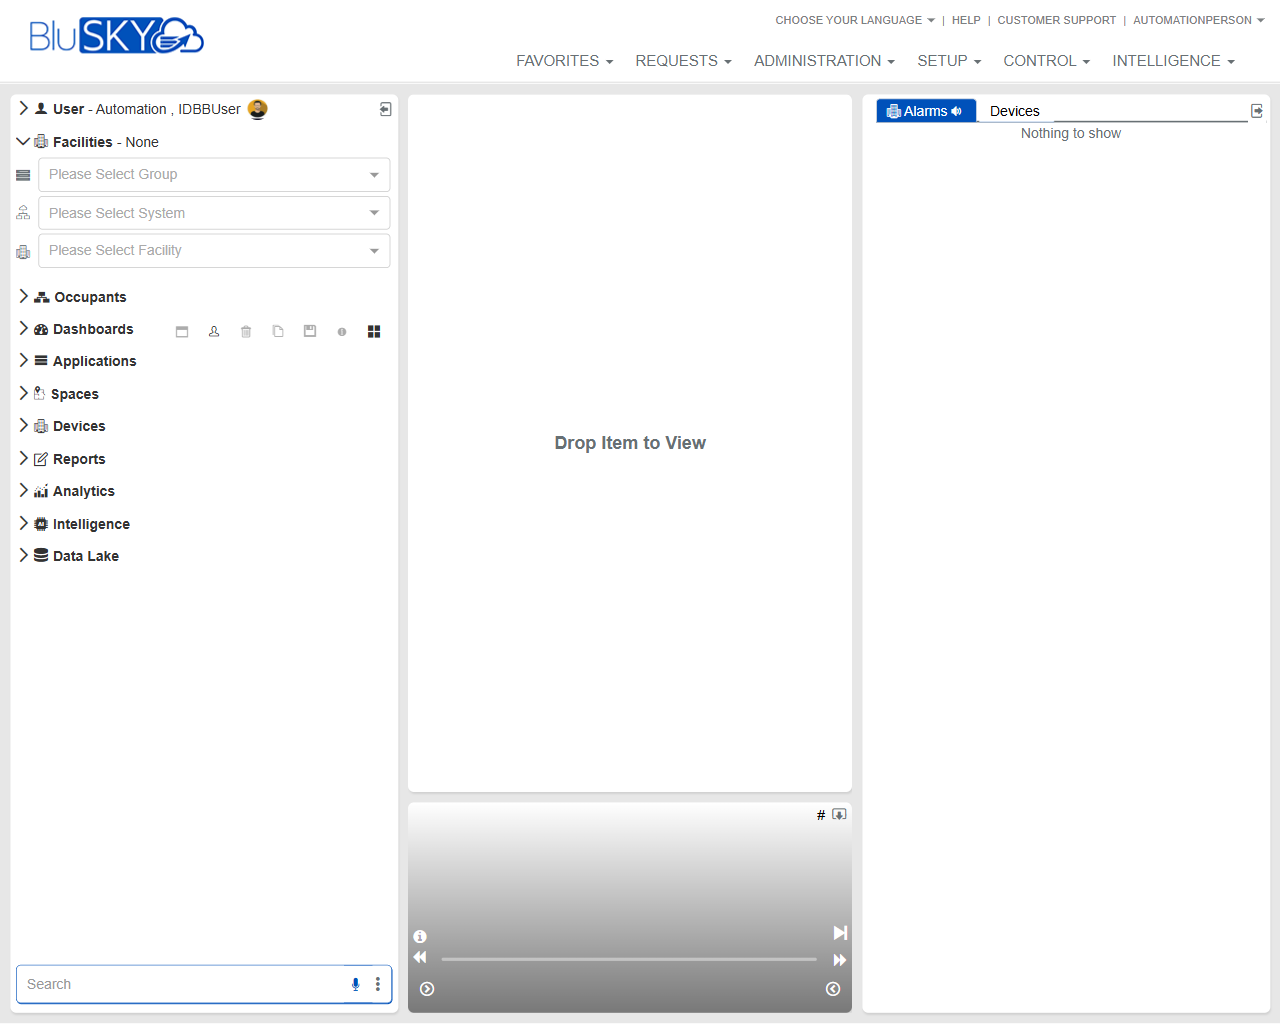
Screen Overview
The BluSKY Workspace is the primary operator landing page. It provides:
- Global navigation (Favorites, Requests, Administration, Setup, Control, Intelligence).
- Context selectors for Group, System, and Facility.
- A left navigation to open functional areas (Occupants, Dashboards, Applications, Spaces, Devices, Reports, Analytics, Intelligence, Data Lake).
- A central drag‑and‑drop canvas to open items (“Drop Item to View”).
- A right Alarms panel for real‑time monitoring. This screen is designed for day‑to‑day operations and quick access to modules, data, and live status.
Field Definitions
| Field Label | Definition | Notes |
|---|---|---|
| User | Displays the signed‑in user name. | Read‑only; opens user menu when clicked (profile/logout where available). |
| Choose Your Language | Global language selector. | Affects UI labels and messages. |
| Help | Link to BluSKY help resources. | Opens documentation/support content. |
| Customer Support | Link to customer support options. | May open support portal or contact methods. |
| Favorites (menu) | Global menu to access saved or pinned items. | Contents depend on user preferences/permissions. |
| Requests (menu) | Global menu for service or operational requests. | Visibility and options are role‑based. |
| Administration (menu) | Global admin functions (tenants, users, policies, etc.). | Shown only to users with administrative rights. |
| Setup (menu) | System setup and configuration tasks. | Role‑based visibility. |
| Control (menu) | Operational controls and monitoring tools. | Role‑based visibility; often used by operators. |
| Intelligence (menu) | Analytics and intelligence features. | Role‑based visibility. |
| Facilities – None | Current context indicator. | Shows “None” until a facility context is selected. |
| Please Select Group | Context selector for organizational Group. | Choose first to filter Systems and Facilities. |
| Please Select System | Context selector for System within the chosen Group. | Filters available Facilities. |
| Please Select Facility | Context selector for Facility within the chosen System. | Determines data shown across the workspace. |
| Occupants (navigation) | Opens people/occupant management areas. | Left navigation entry. |
| Dashboards (navigation) | Opens available dashboards and widgets. | Items can be opened on the canvas. |
| Applications (navigation) | Opens integrated or specialty BluSKY applications. | Availability varies by deployment. |
| Spaces (navigation) | Access to locations, floors, and areas. | Context-sensitive to selected facility. |
| Devices (navigation) | Access to controllers, readers, cameras, etc. | Often used for live status and control. |
| Reports (navigation) | Reporting tools and saved reports. | Some reports can open in the canvas. |
| Analytics (navigation) | Analytical views and KPIs. | Availability depends on licensing. |
| Intelligence (navigation) | Advanced intelligence features. | Separate from the top global menu item of the same name. |
| Data Lake (navigation) | Access to data lake resources/exports. | Advanced/enterprise feature. |
| Search (left sidebar) | Search box for finding items within the left navigation. | Filters navigation items as you type. |
| Workspace Canvas | Central area where items are opened; shows “Drop Item to View” when empty. | Supports drag‑and‑drop from navigation where applicable. |
| Alarms Panel | Right‑hand panel listing real‑time alarms/events. | Auto‑updates; empty state shows “Nothing to show.” |
| Alarm Category Selector (Devices) | Tab or filter within Alarms (set to Devices). | Selects the alarm source/category. |
| Viewer/Widget Toolbar (bottom of canvas) | Contextual controls for the active widget/view (e.g., info, mute, play). | Appears when a compatible view (video/widget) is active. |
| Drop Item to View (message) | Empty‑state instruction in the canvas. | Indicates the canvas is ready for drag‑and‑drop. |
Screen Actions and Functions
- Select Group, System, and Facility to set the working context.
- Click a left navigation item to open its list or tools.
- Drag an available item (e.g., a dashboard or report) into the Workspace Canvas to view it.
- Use the Alarms panel to monitor live device alarms; switch categories using the selector.
- Use the Search box to quickly filter and locate items in the left navigation.
- Access global actions from the top menus (Favorites, Requests, Administration, Setup, Control, Intelligence).
- Open help and support via the header links; switch language as needed.
Usage Instructions & Examples
How to set your working context
- In the left header area, click Please Select Group and choose the appropriate Group.
- Click Please Select System and choose the System for that Group.
- Click Please Select Facility and choose the Facility you want to work with.
- Confirm the Facilities indicator no longer shows “None.”
How to open a dashboard in the canvas
- Ensure your Facility context is selected.
- Click Dashboards in the left navigation to reveal available dashboards.
- Drag the desired dashboard onto the Workspace Canvas where it says “Drop Item to View.”
- Use any toolbar that appears to interact with the dashboard (e.g., refresh or playback if provided).
How to monitor device alarms
- Set the context to the Facility you wish to monitor.
- Look at the right Alarms panel; ensure the category selector is set to Devices.
- When alarms appear, click an alarm entry (if enabled) to view more details or navigate to the source.
How to quickly find a module or item
- In the left Search box, start typing a keyword (e.g., “Reports” or the name of a dashboard).
- Click the matching item in the filtered navigation.
- If supported, drag the item onto the canvas to open it.
System Behaviors and Edge Cases
- If no Facility is selected, many views will be empty and the Alarms panel may display “Nothing to show.”
- The System and Facility selectors are filtered by the chosen Group; unavailable combinations are not offered.
- Items that do not support canvas display cannot be dropped; the canvas ignores unsupported drops.
- Menu entries and navigation items are role‑based; users without permissions will not see restricted modules.
- The Alarms panel updates in real time; if there are no active alarms, the panel remains blank.
- Some widgets/views expose a contextual toolbar only after the item loads in the canvas.
Permissions
- Access to Administration and Setup menus requires administrative roles.
- Viewing and controlling Devices and live Alarms requires operator privileges specific to those modules.
- Availability of Dashboards, Reports, Analytics, Intelligence, and Data Lake depends on licensing and assigned roles.
- Facility, System, and Group options are restricted to the user’s scope.
Linked Workflows
- From the Workspace, open Devices to investigate an alarm source and perform device actions.
- After selecting a Facility, navigate to Occupants to manage people and credentials.
- Drag a Report or Dashboard to the canvas for live monitoring and export.
- Use Administration and Setup to configure tenants, systems, and facilities before operational use.
Reference Image Links