Elevator Management System Beta
BluSKY Home Workspace
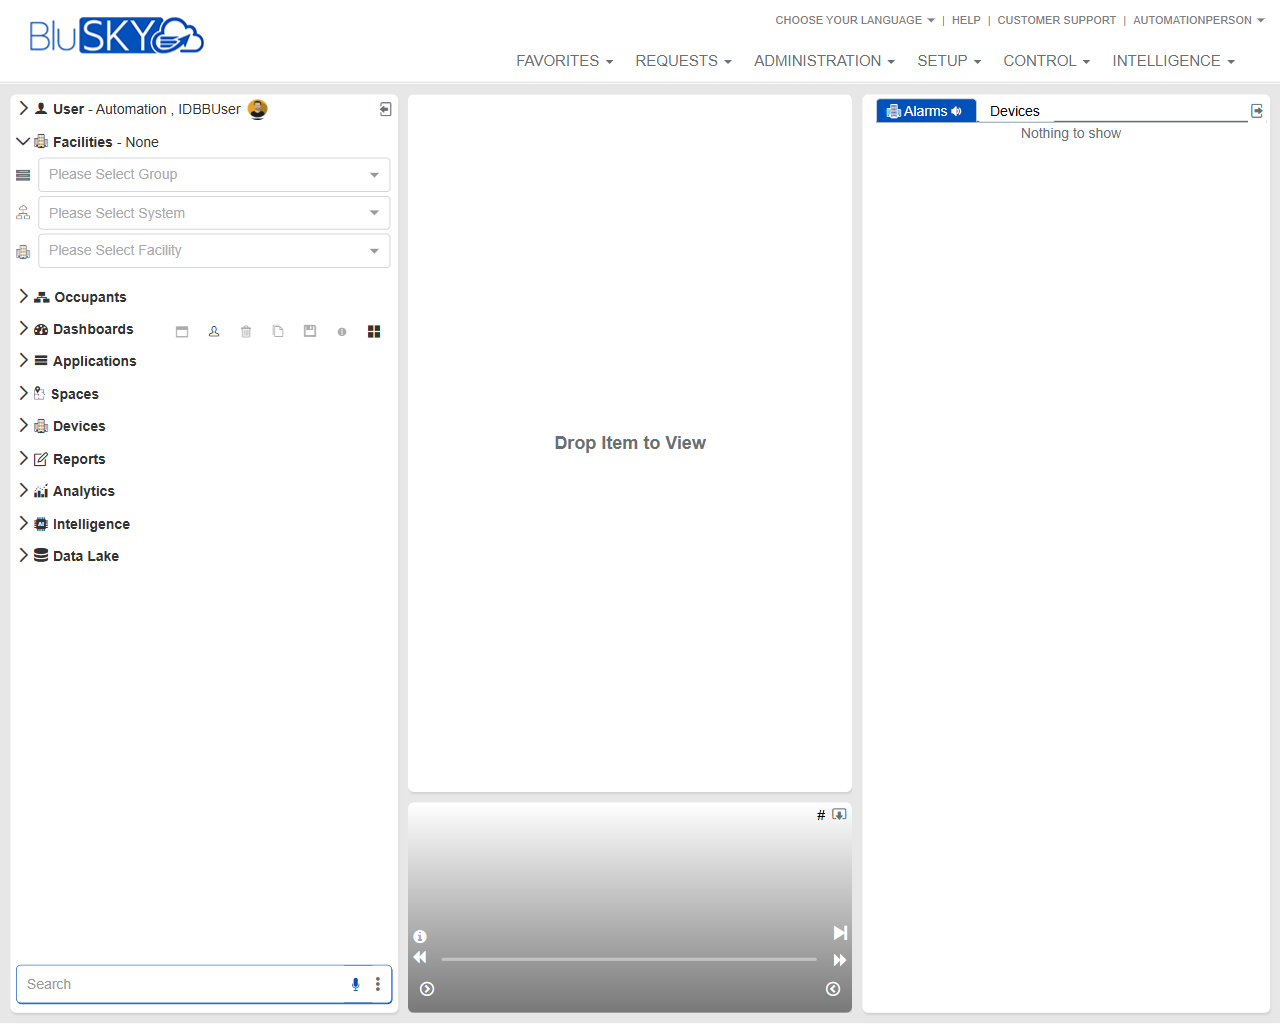
Screen Overview
The BluSKY Home Workspace is the primary landing page for navigating BluSKY modules and monitoring activity. It provides:
- Left navigation for selecting Facility context and modules.
- A central workspace canvas where items can be opened by drag-and-drop.
- A right-side panel for quick monitoring of Alarms and Devices.
- A global top menu for Favorites, Requests, Administration, Setup, Control, and Intelligence.
Field Definitions
| Field Label | Definition | Notes |
|---|---|---|
| User (top-left) | Displays the currently signed-in user. | Read-only; used to verify active account. |
| Facilities – None | Shows the current facility scope for data and views. | Updates after Group/System/Facility selections. |
| Please Select Group | Drop-down to choose a facility group. | Selecting a Group filters available Systems and Facilities. |
| Please Select System | Drop-down to choose a system within the selected group. | Options depend on the chosen Group. |
| Please Select Facility | Drop-down to choose the active facility. | Required to see facility-scoped data in many modules. |
| Occupants (nav) | Opens occupant-related views. | Expandable navigation section. |
| Dashboards (nav) | Opens available dashboards. | May include saved dashboards and widgets. |
| Applications (nav) | Opens application-specific tools. | Availability depends on licensing and permissions. |
| Spaces (nav) | Opens space and location management views. | Expandable. |
| Devices (nav) | Opens device lists, status, and controls. | Drag to canvas to view device lists or details. |
| Reports (nav) | Opens reporting options. | Some reports require a facility context. |
| Analytics (nav) | Opens analytics and data visualization tools. | Access controlled by role. |
| Intelligence (nav) | Opens intelligence features. | Access controlled by role. |
| Data Lake (nav) | Opens raw data and historical datasets. | Often read-only; export governed by policy. |
| Search (left bottom) | Filters the left navigation by keyword. | Matches module/item names in real time. |
| Workspace Canvas (“Drop Item to View”) | Central area where views open when dragged from the left nav. | Supports multiple items opened sequentially; layout persists for the session. |
| Media/Player Bar (bottom center) | Transport controls and timeline when video or media is opened. | Hidden/inactive until a media-capable item is opened. |
| Alarms (right panel tab) | Real-time alarm/event feed. | Shows current or recent alarms; may auto-refresh. |
| Devices (right panel tab) | Quick list/status of devices. | Shows “Nothing to show” if no context or no devices match. |
| Favorites (top menu) | Opens saved shortcuts to frequently used items. | Content varies per user. |
| Requests (top menu) | Access to service or workflow requests. | Availability varies by tenant configuration. |
| Administration (top menu) | Administrative functions and records. | Restricted to admin roles. |
| Setup (top menu) | System and site configuration tools. | Restricted to setup/configuration roles. |
| Control (top menu) | Operational controls and live monitoring tools. | Often limited to operator roles. |
| Intelligence (top menu) | Advanced analytics and insights. | Restricted to licensed, authorized users. |
| Choose Your Language (top-right) | Selects the UI language. | Applies to labels and menus after selection. |
| Help (top-right) | Opens product help resources. | May open in a new tab/window. |
| Customer Support (top-right) | Links to support options. | Contact method depends on deployment. |
Screen Actions and Functions
- Select Group/System/Facility to set the working context for data and views.
- Expand a navigation section (e.g., Devices, Dashboards) to locate desired items.
- Drag an item from the left navigation and drop it onto the Workspace Canvas to open it.
- Click the Alarms or Devices tab in the right panel to toggle the quick-view list.
- Use the Search box to filter the left navigation by keyword.
- Resize panels by dragging panel borders (left tree, canvas, right panel).
- Use the Media/Player Bar to play, pause, or scrub when viewing media-capable items.
- Access top-menu areas (Favorites, Requests, Administration, Setup, Control, Intelligence) for broader workflows.
- Collapse/expand the left navigation to maximize canvas space.
Usage Instructions & Examples
How to set your facility context
- In the left panel, open the Facilities section.
- Select a Group from “Please Select Group.”
- Select a System from “Please Select System.”
- Select a Facility from “Please Select Facility.”
- Confirm the header reads the chosen facility instead of “Facilities – None.”
How to open a device list on the canvas
- Expand the Devices section in the left navigation.
- Drag the desired device list or node onto the Workspace Canvas labeled “Drop Item to View.”
- Review the loaded view; use the right Devices tab for quick reference if needed.
How to monitor alarms
- Ensure the proper Facility is selected.
- Click the Alarms tab in the right panel.
- Observe incoming alarms; select an item (if available) to view more detail in the main view or follow provided links.
How to quickly find a module
- Type a keyword (e.g., “report” or “dashboard”) in the Search field at the bottom-left.
- Click the matching item in the filtered navigation.
- Drag it to the canvas or click to open, depending on item behavior.
System Behaviors and Edge Cases
- If no Facility is selected, many views and the right panel may show “Nothing to show.”
- Dragging items not supported by the canvas will be ignored or blocked.
- Navigation content and available items dynamically change based on the selected Group/System/Facility.
- The Alarms and Devices panels may auto-refresh at a configured interval; if there are no results, the panels remain empty.
- The Media/Player Bar appears only when a media-capable item (e.g., video) is open.
- Panel sizes and open items typically persist only for the current session; a browser refresh may reset the layout.
- Items, menus, or data you cannot access are hidden or disabled based on permissions.
- Changing the language updates UI labels; some screens may require a refresh to fully localize.
Permissions
- All authenticated users can access the Home Workspace; visible modules depend on assigned roles.
- Viewing Devices, Reports, Analytics, Intelligence, or Data Lake requires corresponding view permissions.
- Monitoring alarms in the right panel requires alarm/monitoring permissions.
- Media playback requires video viewing permissions.
- Administration, Setup, and Control menus are restricted to users with administrative/operator permissions.
Linked Workflows
- From Devices on the canvas, proceed to device details, status checks, or control functions.
- From Dashboards, navigate to detailed reports or analytics drilldowns.
- Use Reports to export data relevant to the selected Facility.
- From Alarms, pivot to alarm detail views or operational response workflows (as permitted).
- Use Favorites to streamline frequent tasks across Administration, Setup, and Control.
Reference Image Links