Elevators Beta
Dashboards Workspace
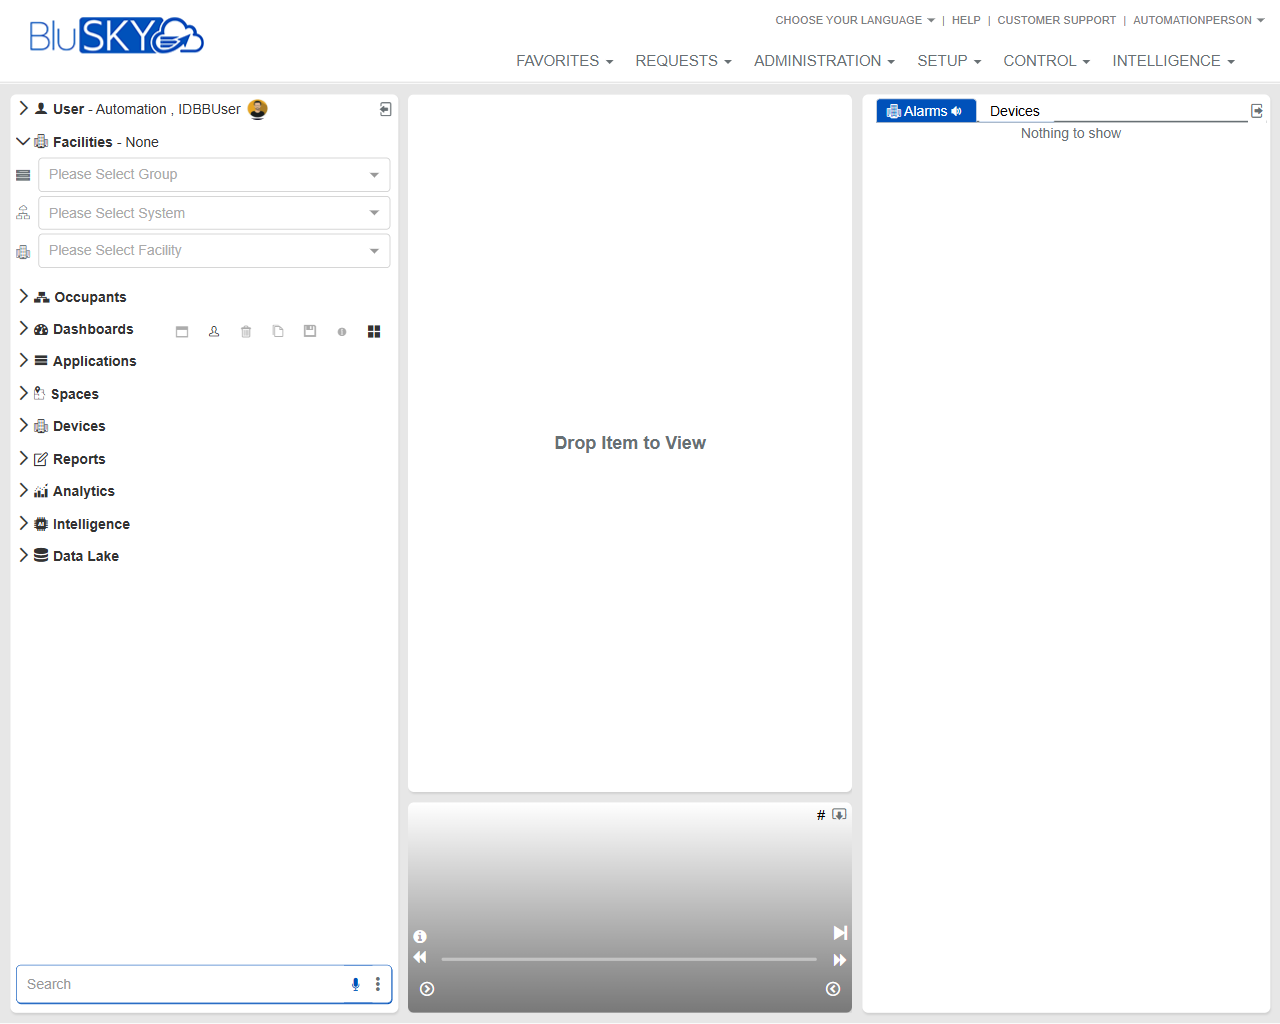
Screen Overview
The Dashboards Workspace is a flexible, drag‑and‑drop canvas for viewing live system information across BluSKY. Users can select a Group/System/Facility context, browse modules from the left navigation, and drop items onto the central canvas to view details. A right-hand panel presents real‑time Alarms. This screen is commonly used for ad‑hoc monitoring, quick investigations, and assembling on‑the‑fly dashboards without leaving the main workspace.
Field Definitions
| Field Label | Definition | Notes |
|---|---|---|
| Favorites (top menu) | Opens saved shortcuts to frequently used pages and dashboards. | Read-only list based on user or tenant favorites. |
| Requests (top menu) | Entry point for service, change, or access requests. | Availability depends on tenant configuration. |
| Administration (top menu) | Links to administrative tools such as user, role, and policy management. | Requires administrative permissions. |
| Setup (top menu) | Links to system configuration (hardware, integrations, schedules, etc.). | Requires setup/configure permissions. |
| Control (top menu) | Operational controls for devices and systems (e.g., doors, elevators). | Live actions; permissions strictly enforced. |
| Intelligence (top menu) | Access to analytics, insights, and advanced reporting. | May be licensed features. |
| Choose Your Language | Sets UI language for the current session. | User preference persists when supported. |
| Help | Opens help resources and product documentation. | May open in a new tab/window. |
| Customer Support | Shortcut to customer support contact and ticketing options. | Tenant-specific routing may apply. |
| User Menu (header) | Current user options (profile, logout, preferences). | Labels and options vary by role. |
| Group (Facilities selector) | Selects the enterprise or portfolio grouping to scope data. | Changing Group clears System and Facility. |
| System (Facilities selector) | Narrows scope to a specific security system within the Group. | Disabled until a Group is selected. |
| Facility (Facilities selector) | Selects the building/site to view. | Determines content available on this workspace. |
| Occupants (left navigation) | Module node for people, visitors, and identities. | Drag items or click to navigate deeper. |
| Dashboards (left navigation) | Module node for saved dashboards and widgets. | Drag a dashboard to open it in the canvas. |
| Applications (left navigation) | Access to application-specific tools/features. | Contents depend on licensed apps. |
| Spaces (left navigation) | Sites, buildings, floors, and areas. | Dragging a space can open a contextual view. |
| Devices (left navigation) | Hardware and endpoints (doors, readers, cameras, etc.). | Drag a device to view status or live data. |
| Reports (left navigation) | Saved and ad‑hoc reports. | Drag a report to run/show it in the canvas. |
| Analytics (left navigation) | Analytic views and widgets. | Availability depends on licensing. |
| Intelligence (left navigation) | Advanced analytic assets similar to top menu Intelligence. | Naming mirrors the top menu; scope differs by node. |
| Data Lake (left navigation) | Access to historical datasets and exports. | For data exploration; performance depends on dataset size. |
| Left Panel Search | Filters items in the left navigation tree. | Supports partial text match; not a global search. |
| Viewer Canvas | Central drop zone where items render (“Drop Item to View”). | Supports multiple items; layout varies by item type. |
| Event/Media Bar (bottom of canvas) | Playback/controls for items that support timelines or media. | Controls appear only for compatible items. |
| Alarms Panel (right) | Real‑time list of active alarms for the current context. | Auto-refreshes; shows “Nothing to show” when empty. |
| Devices Filter (right panel header) | Filter/scope selector for alarms by device category. | Options depend on selected Facility and permissions. |
| Right Panel Content Area | Displays filtered alarms or device events. | Read-only unless user has acknowledge/resolve rights. |
Screen Actions and Functions
- Select Group, System, and Facility to set the working context for all data.
- Drag items from the left navigation (e.g., a device, report, or dashboard) onto the Viewer Canvas to open them.
- Click a left navigation node to expand and browse its children.
- Use the Left Panel Search to quickly locate items to drag into the canvas.
- Monitor the Alarms Panel; adjust the Devices Filter to limit which alarms are shown.
- Use the Event/Media Bar controls when an item supports playback or timeline review.
- Open top menu modules (Favorites, Requests, Administration, Setup, Control, Intelligence) to navigate to full-feature pages.
Usage Instructions & Examples
How to scope the workspace to a building
- In the Facilities selector, choose a Group.
- Select the corresponding System.
- Choose the desired Facility. All lists and alarms refresh to that context.
How to view a device live status
- Ensure the correct Facility is selected.
- Expand Devices in the left navigation.
- Drag the desired device onto the Viewer Canvas.
- Interact with the device view as available (e.g., status, commands, video).
How to run a saved report in the canvas
- Select Group/System/Facility as needed.
- Expand Reports in the left navigation.
- Drag a saved report to the Viewer Canvas.
- If prompted, enter report parameters and run. Review results inline.
How to monitor active alarms
- Confirm the Facility is set.
- In the right Alarms Panel, set the Devices Filter to the category you care about.
- Review active alarms. If you have privileges, open the alarm item to act in the dedicated console.
System Behaviors and Edge Cases
- If no Facility is selected, many items cannot render in the canvas; the Alarms Panel shows “Nothing to show.”
- Changing Group resets the System and Facility selections to prevent cross-context data mixing.
- Items that do not support canvas rendering will not drop; the cursor shows not-allowed and no panel opens.
- The Alarms Panel auto-refreshes; if there are no active alarms for the selected filters, the list remains empty.
- The Event/Media Bar only appears for items with timelines or media; otherwise it is hidden or disabled.
- Navigation nodes and actions are permission-aware; users only see or can open items they are allowed to access.
- Very large reports or analytics may take longer to render; a loading indicator is shown until complete.
Permissions
- General access: Users must be authenticated and granted Read access to modules they wish to view.
- Facilities selectors: Requires permission to view the chosen Group/System/Facility.
- Devices on canvas: Requires ViewDevices; issuing commands requires ControlDevices or equivalent.
- Reports/Analytics: Requires ViewReports/ViewAnalytics; running certain reports may require RunReports.
- Alarms Panel: Requires ViewAlarms; acknowledging/clearing alarms requires AcknowledgeAlarms or ResolveAlarms.
- Administration/Setup/Control menus: Visible and usable only to roles with corresponding admin/config/control rights.
Linked Workflows
- From a device view, open the full Device Detail or Control page for advanced actions.
- From the Alarms Panel, drill into the Alarm Console to acknowledge, comment, or resolve events.
- From a report rendered in the canvas, export or open the full Reports module for scheduling and distribution.
- From Dashboards, open the full Dashboards module to save, share, or manage layouts.
- From Occupants, navigate to People/Visitor management for identity updates tied to the selected Facility.
Reference Image Links