Control Points
Dashboards Screen
Screen Overview
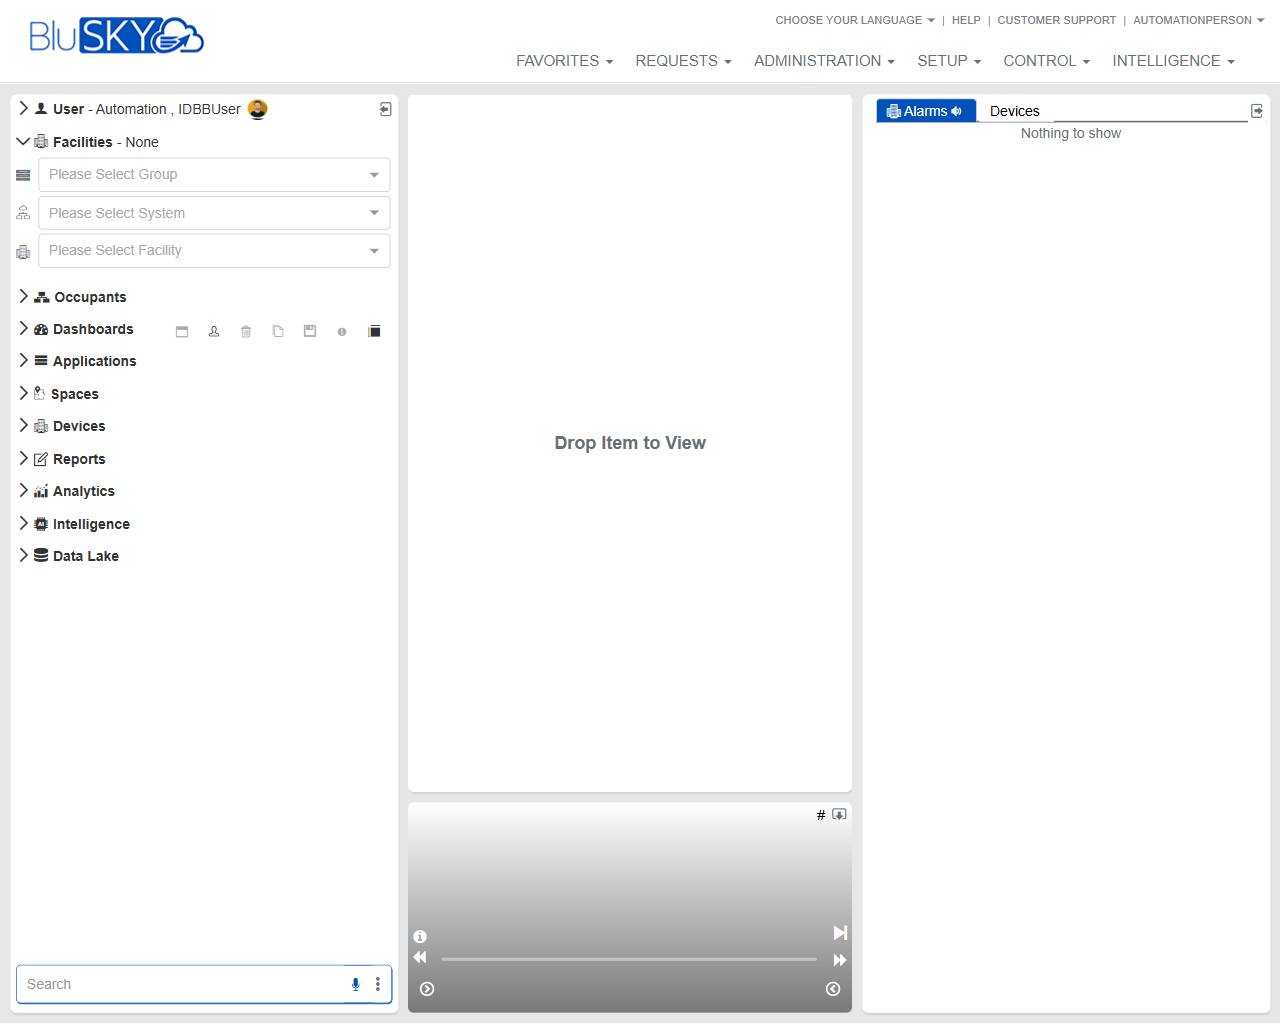
The Dashboards screen provides a flexible workspace to monitor and interact with BluSKY data. Users can select a Group/System/Facility context, expand navigation categories, and drag items into the central canvas to view live information. A right-side Alarms panel displays device-related events, and a bottom media bar provides playback controls for video-capable items.
Field Definitions
| Field Label | Definition | Notes |
|---|---|---|
| Choose Your Language | Top-bar selector to change the application language. | Changing language refreshes UI text for the current session. |
| Help | Opens online help resources. | Read-only; opens in a new tab/window. |
| Customer Support | Shortcut to support contact/resources. | Availability depends on subscription. |
| User – Automation, IDBUser | Displays the currently signed-in user. | Read-only; may contain session/profile options. |
| Favorites (top menu) | Menu for quick access to favorited pages. | Contents vary per user. |
| Requests (top menu) | Access to request and ticketing workflows. | Visibility based on permissions. |
| Administration (top menu) | Access to administrative tools and data management. | Requires admin-level permissions. |
| Setup (top menu) | Configuration area for systems, devices, and settings. | Requires setup/config permissions. |
| Control (top menu) | Operational controls and live monitoring tools. | Often used by operators/guards. |
| Intelligence (top menu) | Analytics, rules, and higher-level insights. | Availability depends on licensing/role. |
| Facilities – None | Current facility context indicator. | Shows “None” until a facility is selected. |
| Please Select Group | Dropdown to select an organizational Group context. | Filters systems and facilities shown elsewhere. |
| Please Select System | Dropdown to choose the BluSKY-connected system. | Options filtered by selected Group. |
| Please Select Facility | Dropdown to set the active facility/site. | Determines which items are available to view. |
| Left Navigation Tree | Collapsible navigation listing major categories. | Used to locate items to drag into the workspace. |
| Occupants (left nav) | Category for people/tenants/visitors data. | Content filtered by selected context. |
| Dashboards (left nav) | Category for dashboard layouts and widgets. | May include saved or predefined widgets. |
| Applications (left nav) | Category for app modules and tools. | Availability depends on role. |
| Spaces (left nav) | Category for areas, floors, rooms, or zones. | Context-driven. |
| Devices (left nav) | Category for hardware endpoints (e.g., readers, cameras). | Drag items from here to view details or live data. |
| Reports (left nav) | Category for reporting modules. | Opens report screens when selected. |
| Analytics (left nav) | Category for analytical views/KPIs. | License- and role-dependent. |
| Intelligence (left nav) | Category for alerting/rules/insights. | May overlap with top-bar Intelligence. |
| Data Lake (left nav) | Category for data storage/extraction features. | Enterprise feature; may be restricted. |
| Search (left panel) | Text search to quickly locate items in the left tree. | Searches within the currently visible category tree. |
| Main Workspace (Drop Item to View) | Central canvas where items are displayed after drag-and-drop. | Supports multiple tiles; layout persists for the session. |
| Alarms (right panel) | Sidebar listing alarm events for the selected context. | Shows “Nothing to show” when no events match filters. |
| Devices (right panel tab) | Tab within the Alarms panel scoping alarms to devices. | Other tabs may be available depending on configuration. |
| Media/Playback Bar | Controls for live/recorded media (play, pause, volume). | Appears when a video-capable item is active. |
Screen Actions and Functions
- Select Group/System/Facility to set the working context.
- Expand a left navigation category and drag an item onto the Main Workspace to open it.
- Monitor alarms in the right Alarms panel; select the Devices tab to scope to hardware events.
- Use the Search field to find items within the left navigation tree.
- Use media controls to play/pause and adjust volume for video-capable items.
- Resize panels (where supported) to optimize the workspace.
Usage Instructions & Examples
How to set your working context
- Open the Facilities section at the top-left.
- Choose a Group from the Please Select Group dropdown.
- Choose a System from the Please Select System dropdown.
- Choose a Facility from the Please Select Facility dropdown.
How to view an item on the dashboard
- In the left navigation, expand a category such as Devices or Dashboards.
- Drag the desired item onto the Main Workspace where it says “Drop Item to View.”
- Interact with the opened tile (e.g., view status or, for cameras, use playback controls).
How to monitor alarms
- Ensure the correct Facility context is selected.
- In the right panel, select the Devices tab under Alarms.
- Review live entries; click an alarm (if supported) to open the related item in the Main Workspace.
How to quickly find an item
- Type a keyword in the Search field at the bottom-left.
- Select a result in the left tree and drag it into the workspace to view.
System Behaviors and Edge Cases
- If no Facility is selected, categories may appear empty and the Alarms panel shows “Nothing to show.”
- The Alarms panel updates automatically with new events for the active context.
- Dragging an unsupported item to the workspace will not open a tile; a message may indicate the action is not allowed.
- Media controls appear only when a video-capable item is active; network or permission issues can prevent playback.
- Language changes refresh UI text; some content (e.g., item names) may remain in their original language.
- Session timeouts or permission changes during use can close or hide open tiles.
Permissions
- Access to the Dashboards screen requires a standard application login with view permissions.
- Viewing devices and alarms typically requires permissions such as ViewDevices and ViewAlarms.
- Video playback may require additional ViewVideo/LiveView permissions.
- Top-bar menus (Administration, Setup, Intelligence) appear only for roles granted those capabilities.
Linked Workflows
- From a viewed device tile, navigate to Setup to configure device properties (requires setup permissions).
- Use Reports to generate history for alarms observed in the Alarms panel.
- Use Analytics/Intelligence to build KPI widgets or rules, then drag resulting widgets into the workspace.
- Favorites can bookmark frequently used dashboards or devices for faster access.
Reference Image Links