Data Lake
Workspace Screen
Screen Overview
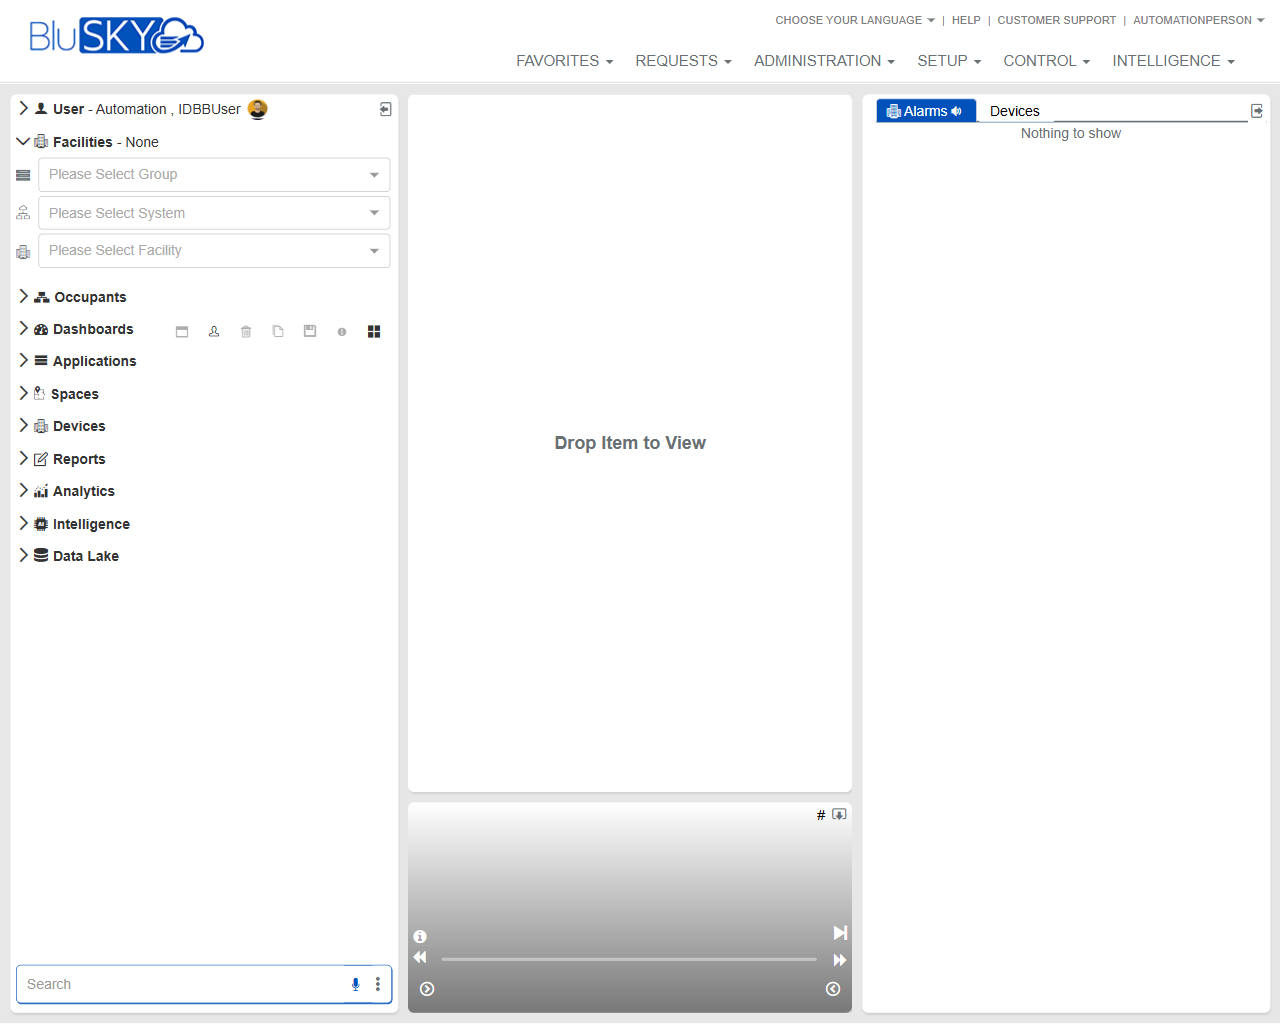
The Workspace screen is the primary landing page in BluSKY. It provides a left navigation tree for browsing modules, a central drag-and-drop work area to open views, and a right-hand panel for real-time alarms and device status. Use the context selectors at the top-left to filter by Group, System, and Facility, then drag items from the navigation tree into the work area to view or manage them.
Field Definitions
| Field Label | Definition | Notes |
|---|---|---|
| User (header) | Displays the currently signed-in user. | Read-only. Provides quick context of the active account. |
| Facilities (header) | Indicates the current facility scope. | Shows “None” until a Facility is selected. |
| Group | Drop-down to choose a Facility Group. | Optional. Filters available Systems and Facilities. |
| System | Drop-down to choose a System within the selected Group. | Optional. Filters the Facility list. |
| Facility | Drop-down to choose the active Facility. | Recommended. Determines which data appear in the navigation tree and workspace. |
| Occupants | Navigation node to access people and related records. | Expand to reveal sub-items; drag items into the work area to open. |
| Dashboards | Navigation node for dashboards and widgets. | Icons next to the label provide quick actions when available. |
| Applications | Navigation node for BluSKY applications. | Content depends on enabled modules and permissions. |
| Spaces | Navigation node for floors, rooms, and areas. | Drag a space to view its details or map (when configured). |
| Devices | Navigation node for hardware (readers, controllers, cameras, etc.). | Drag a device to view status or details. |
| Reports | Navigation node for standard and custom reports. | Drag a report to run/open it in the work area. |
| Analytics | Navigation node for analytics views. | Availability depends on licensing. |
| Intelligence | Navigation node for advanced insights. | Availability depends on licensing. |
| Data Lake | Navigation node for data lake tools and exports. | Availability depends on licensing. |
| Search (left panel footer) | Search box to quickly locate modules, devices, or pages. | Partial names supported; results filtered by scope and permissions. |
| Work Area (center canvas) | The main viewing pane; shows “Drop Item to View” when empty. | Drag any item from the left navigation to open it here. |
| Alarms panel (right) | Real-time list of current alarms and events. | When no items are active, displays “Nothing to show.” |
| Devices tab (right panel header) | Filter or tab within the right panel related to devices. | Use to focus the right panel on device-related items. |
| Top navigation (Favorites, Requests, Administration, Setup, Control, Intelligence) | Global menus for jumping to major BluSKY areas. | Visibility depends on role and permissions. |
| Language / Help / Customer Support (top-right) | Utilities for language selection and assistance. | Links/menus open in overlays or new tabs, depending on configuration. |
Screen Actions and Functions
- Select Group, System, and Facility to set the working scope for navigation and views.
- Expand any navigation node and drag an item into the Work Area to open its details.
- Use the Search field to find pages, devices, or objects; press Enter to navigate.
- Review the Alarms panel to monitor current alarms; click an entry (when present) to open its source in the Work Area.
- Resize panes by dragging the borders between the left navigation, work area, and right panel.
- Collapse/expand navigation sections to streamline browsing.
Usage Instructions & Examples
-
Set your working scope
- Open the Group drop-down and select the relevant group.
- Choose a System (optional) to narrow Facilities.
- Select a Facility to scope data across the screen.
-
Open a device view
- Expand Devices in the left navigation.
- Drag the desired device onto the Work Area.
- Review the device details shown in the center pane.
-
Run a report
- Expand Reports.
- Drag a report into the Work Area.
- If prompted, provide parameters and run the report.
-
Monitor alarms
- Check the Alarms panel on the right.
- When entries appear, click an alarm to open its associated item in the Work Area.
-
Find a module quickly
- Type a keyword in the Search field (e.g., “occupant” or “reader”).
- Select a result to navigate directly or drag it into the Work Area if supported.
System Behaviors and Edge Cases
- If no Facility is selected, some nodes may be empty or limited to global items.
- The Alarms panel displays “Nothing to show” when there are no active alarms in scope.
- Visibility of nodes and menu items is filtered by licensing and user permissions; unavailable modules are hidden.
- Dragging an unsupported item to the Work Area has no effect and the view remains unchanged.
- Pane sizes and some selections may persist for the current browser session; clearing cache or signing out can reset them.
- Session timeouts close the workspace; any unsaved form data in an open view may be lost upon timeout.
Permissions
- Access to specific nodes (e.g., Devices, Reports, Analytics) requires corresponding view permissions.
- Administration, Setup, Control, and Intelligence menus are visible only to roles granted those capabilities.
- Alarm visibility and the ability to open alarm sources depend on alarm viewing permissions and facility scope.
- Facility, System, and Group options are restricted to those the user is authorized to access.
Linked Workflows
- From Devices opened in the Work Area, proceed to device configuration or status pages as permitted.
- From Occupants, open person records to issue credentials or assign access levels.
- From Reports, export or schedule reports based on report-level permissions.
- From Alarms, navigate to source devices or locations for investigation and resolution.
Reference Image Links