Analytics
Person Reader Automatic Recognition By Occupancy
Screen Overview
The Person Reader Automatic Recognition By Occupancy screen generates a people-analytics chart showing Person Reader automatic recognitions grouped by Occupancy (tenant/space) for a selected Facility. Users can filter by Group and System, render the graph, and optionally save and share the configured graph for future reuse.
Field Definitions
| Field Label | Definition | Notes |
|---|---|---|
| Group | Optional organizational container used to limit the Systems and Facilities available in the picklists. | Changing Group filters the System and Facility lists. Refresh icon reloads options. |
| System | Optional security system selection used to constrain the Facility list and the data returned. | Filtered by Group (if selected). Refresh icon reloads options. |
| Facility | Required Facility whose Person Reader activity is analyzed. | Marked with an asterisk. Filtered by Group/System. Refresh icon reloads options. |
| Name | Saved Graph name. | Required when saving a graph. Must be unique within your ownership/share scope. |
| Share | Scope that determines who can see the saved graph: Me, Company, System, Facility, or Occupancy. | Single-select. Defaults to Me. Selecting broader scopes makes the graph available to more users. |
| Allow others to view | Permission toggle controlling whether users in the chosen Share scope can view the saved graph. | Default No. Setting to Yes grants read-only access unless “Allow others to edit” is also Yes. |
| Allow others to edit | Permission toggle controlling whether users in the chosen Share scope can modify the saved graph definition. | Default No. Enabling edit implies view; editors can change parameters and resave. |
Screen Actions and Functions
- Generate – Renders the Person Reader Automatic Recognition By Occupancy chart using the selected parameters.
- Refresh picklists – The circular-arrow icon next to Group/System/Facility reloads the available options.
- Expand/Collapse “Save Graph” – Shows or hides the save-and-share controls.
- Save – Saves the current graph configuration using Name, Share, and permission toggles.
- Back To Filter – Returns focus to the filter area to adjust parameters without saving.
Usage Instructions & Examples
How to run the analytic
- Open Intelligence > Analytics and choose “Person Reader Automatic Recognition By Occupancy.”
- (Optional) Select a Group to narrow available Systems and Facilities.
- (Optional) Select a System.
- Select a Facility. This field is required.
- Click Generate. The graph area populates with recognitions grouped by Occupancy.
How to save and share a configured graph
- After generating the desired view, expand Save Graph.
- Enter a Name that describes your configuration (e.g., “HQ – PR Recognitions by Tenant”).
- Choose a Share scope (e.g., Company to share with all users in your company).
- Set Allow others to view = Yes. Optionally set Allow others to edit = Yes if collaborators should maintain it.
- Click Save. The graph appears under the Saved Analytics tab for users within the selected scope.
Example: Share to a specific Facility team
- Configure Group/System and select the Facility “North Tower.”
- Generate the chart.
- In Save Graph, set Name = “North Tower PR by Occupancy.”
- Set Share = Facility, Allow others to view = Yes, Allow others to edit = No.
- Save. All users with access to that Facility can view the saved analytic.
System Behaviors and Edge Cases
- Facility is mandatory; Generate remains ineffective until a Facility is selected.
- Picklists are cascading: selecting Group filters Systems; selecting Group/System filters Facilities.
- Refresh icons reload picklist values to reflect recent configuration changes or permissions updates.
- If no data matches the parameters, the chart renders with a “no data” state and no series.
- Name is required to save; the system enforces uniqueness within your ownership/share scope. Duplicate names prompt an error.
- Enabling “Allow others to edit” implicitly allows viewing; the system may auto-enable view or block edit unless view is Yes.
- Changing parameters after generating does not auto-refresh the chart; click Generate again to update results.
- Saved graphs store the selected parameters (Group/System/Facility) and reapply them when reopened; unavailable or permission-restricted items will cause the graph to open but require parameter correction.
Permissions
- Requires access to Intelligence > Analytics.
- View analytic: users with the View Analytics permission for the selected Facility (and Group/System where applicable).
- Save graph: users with Save Analytics (or equivalent) permission.
- Share beyond “Me”: users need Share Analytics (or equivalent) permission for the chosen scope (Company/System/Facility/Occupancy).
Linked Workflows
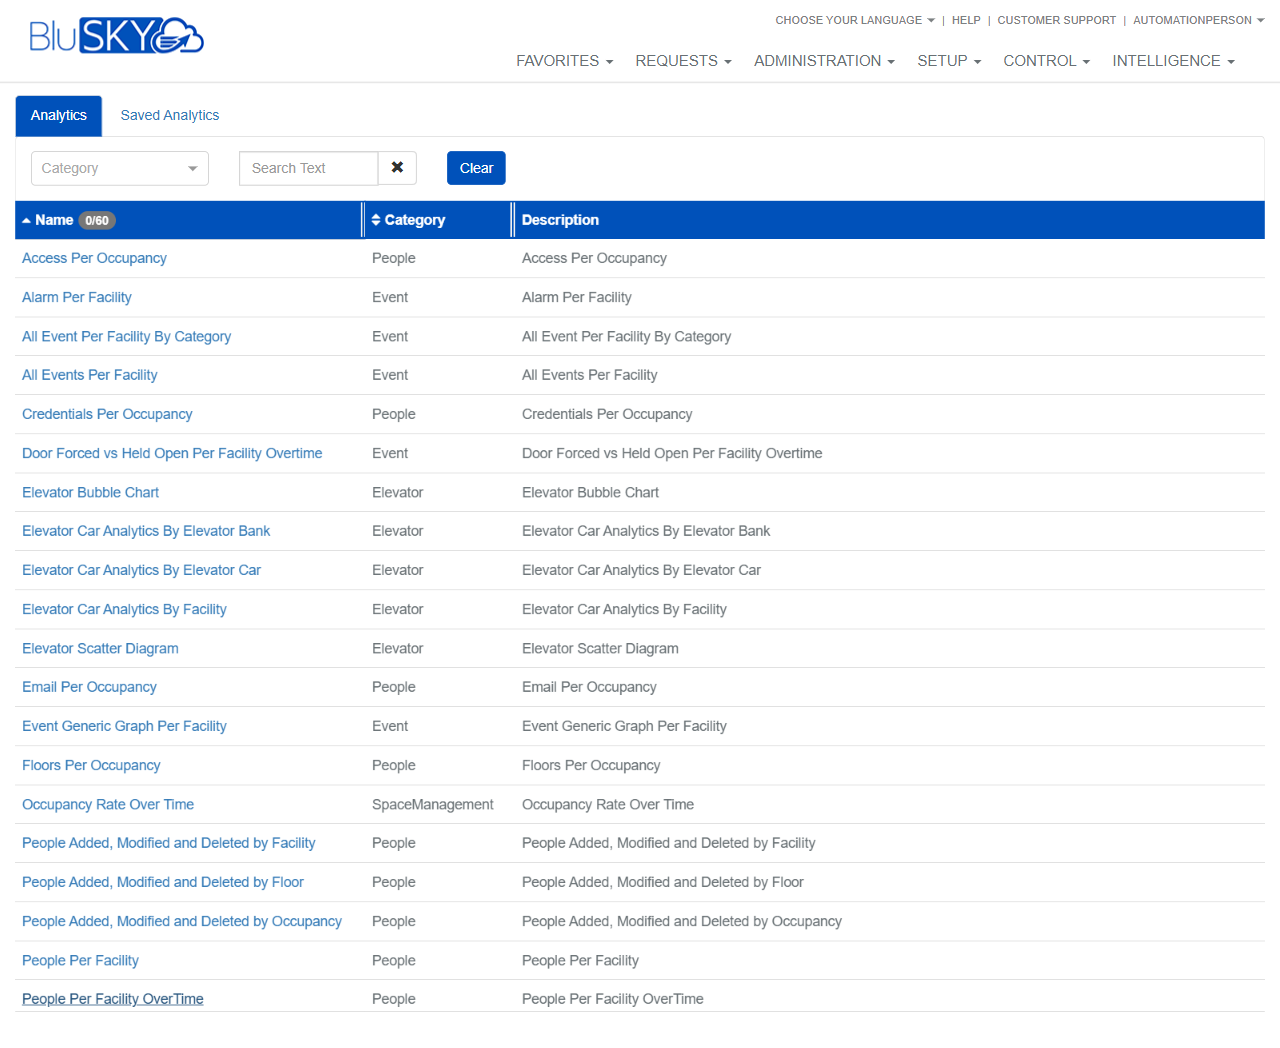
- Analytics catalog: Start from Intelligence > Analytics, then select “Person Reader Automatic Recognition By Occupancy.”
- Saved Analytics: Access previously saved graphs under the Saved Analytics tab.
- Facility or Occupancy management: Adjust Facility/Occupancy definitions in Administration/Setup to affect available filters and data.
Reference Image Links