Analytics Dashboard
Analytics Dashboard
Screen Overview
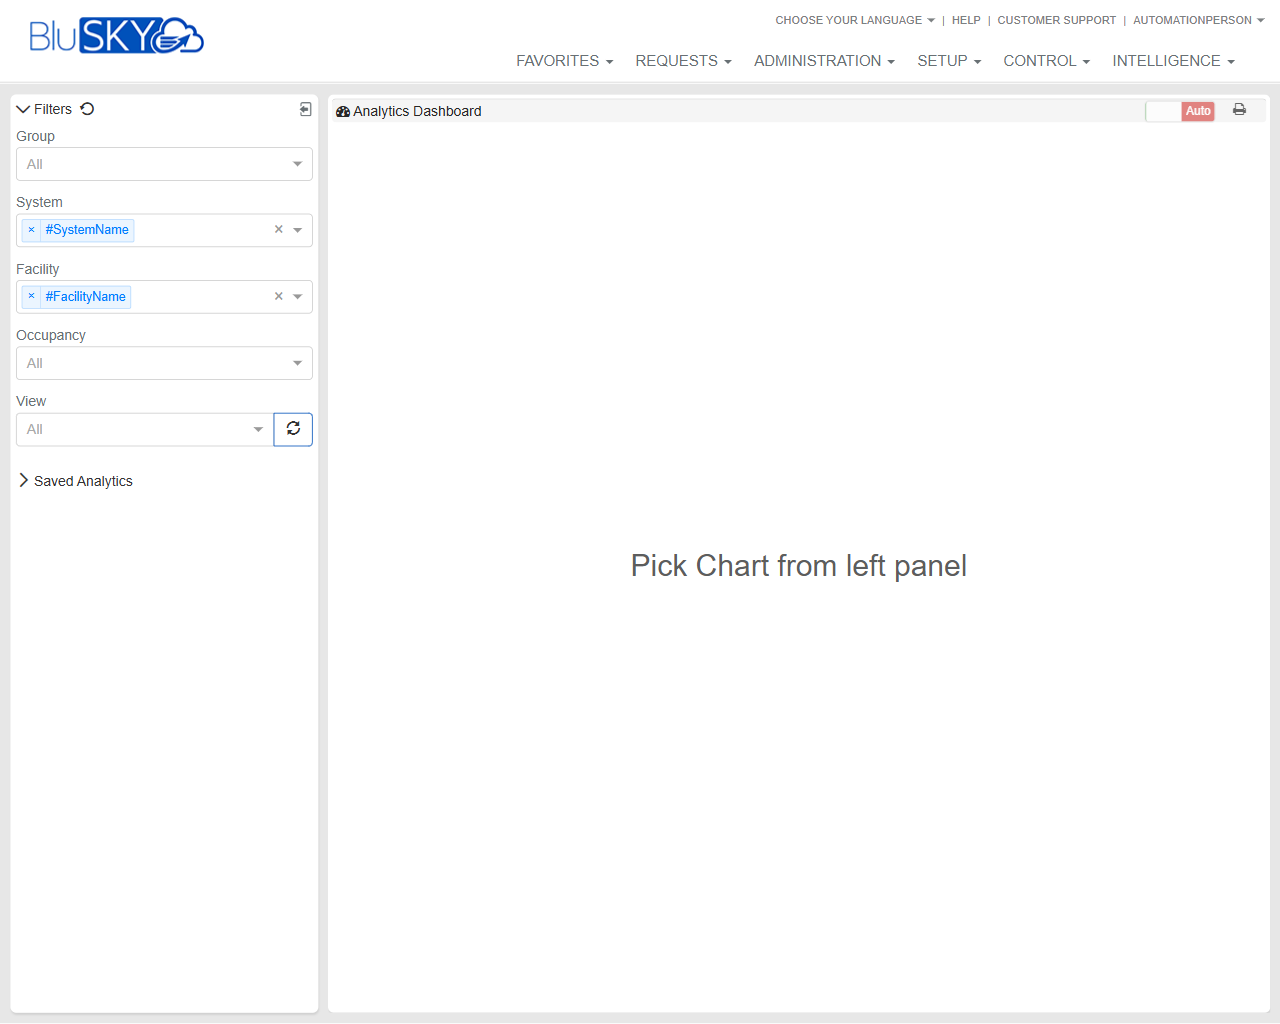
The Analytics Dashboard provides a centralized workspace to visualize BluSKY operational data. Users select a chart, apply filters (Group, System, Facility, Occupancy, View), and render the result on the chart canvas. The page supports manual refresh, optional auto‑refresh, and printing.
Field Definitions
| Field Label | Definition | Notes |
|---|---|---|
| Filters Panel | The left-side panel containing all analytics filters and the Saved Analytics list. | Stays visible while charts render on the right. |
| Group | Limits analytics to a specific organizational group. | Default: All. Options reflect groups the user can access. |
| System | Limits analytics to one or more security systems. | Multi-select with removable tokens. The placeholder “#SystemName” represents the current context system. |
| Facility | Limits analytics to one or more facilities within the selected system(s). | Multi-select with removable tokens. The placeholder “#FacilityName” represents the current context facility. |
| Occupancy | Filters data by occupancy-related criteria. | Default: All. Options vary by deployment. |
| View | Selects the analytics view (chart definition) to display. | Default: All. Choose a specific view before refreshing to render a chart. |
| Refresh (circular arrow) | Executes the query and redraws the chart using the selected filters. | Located to the right of the View field. |
| Saved Analytics | Collapsible list of user- or tenant-saved charts for quick loading. | Selecting an item loads its saved definition and filters onto the canvas. |
| Chart Canvas | The main display area where the selected chart renders. | Shows “Pick Chart from left panel” until a chart is chosen. |
| Auto | Toggle that enables automatic, periodic refresh of the displayed chart. | When enabled, the system re-runs the chart at set intervals. |
| Exports/prints the currently displayed chart. | Opens the browser’s print dialog; applies current filters in the printout. | |
| Analytics Dashboard Header | The title bar of the workspace. | Read-only. Identifies the page location within Intelligence. |
Screen Actions and Functions
- Select a chart from Saved Analytics to load it onto the canvas.
- Choose filter values (Group, System, Facility, Occupancy, View) to refine results.
- Click Refresh to run the chart with current filters.
- Toggle Auto to enable/disable periodic refresh.
- Click Print to open the browser print dialog for the current chart.
- Remove individual System or Facility tokens using the X on each token to quickly adjust scope.
Usage Instructions & Examples
How to load and run a chart
- Expand Saved Analytics and click a saved chart, or choose a View from the View dropdown.
- Set Group, System, Facility, and Occupancy as needed.
- Click Refresh. The chart renders on the canvas.
How to focus analytics on a single facility
- In System, keep only the desired system token(s).
- In Facility, remove all tokens except the target facility.
- Click Refresh to update the chart.
How to keep a live dashboard on a wall display
- Load the desired chart and apply filters.
- Toggle Auto to On.
- Leave the page open; the chart will refresh periodically.
How to print or export a chart
- Ensure the desired chart is visible on the canvas.
- Click Print.
- Use the browser’s dialog to print or save as PDF.
System Behaviors and Edge Cases
- If no chart is selected, the canvas displays “Pick Chart from left panel.”
- Facility options are filtered by the selected System(s); clearing System may broaden available Facilities.
- If filters produce no results, the canvas renders a chart frame with no data.
- Auto refresh re-runs the active chart at a fixed interval; heavy queries may take longer and can delay subsequent refreshes.
- Users only see Groups/Systems/Facilities they’re permitted to access; inaccessible options are hidden.
- Switching View or Saved Analytics overwrites current filter selections with those saved in the chart definition, if applicable.
Permissions
- Accessible to users with Analytics or Intelligence module access (e.g., Global Administrators, Tenant Administrators, or roles granted AnalyticsView).
- Visibility of Groups, Systems, and Facilities is constrained by the user’s assigned scope.
- Print is available to users who can view the chart.
- Managing Saved Analytics (create/modify/delete) requires additional analytics authoring permissions; viewing existing items requires read permission.
Linked Workflows
- To create or edit saved charts, use the Analytics Builder in the Intelligence module.
- Systems and Facilities available in filters are defined under Setup > Systems and Setup > Facilities.
- Group membership and scope are managed under Administration > Roles/Permissions.
Reference Image Links