Input-Output Diagnostics
Overview
The Input-Output Diagnostic page provides a method to control and diagnose the Monitoring Points and Control Points of a System. This article gives a high level look at what the Input-Output Diagnostic can accomplish.
Controller Communication
The Input and Output Diagnostic page allows you to see the commands that are sent and received from the Controller. While many of these commands are encoded and hard to understand it may be necessary to monitor the communication to and from the controller.
The left side contains the commands being sent to the controller. All of the commands that we see are encoded for the controller. This is where BluSKY does the heavy lifting. On the right side, we see all of the replies from the controller. This is where you will see how the controller responded. While this section is fairly cryptic we have provided a list of commands found here.

Controller Selection
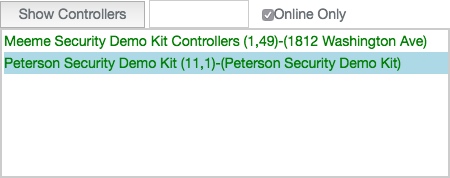
This section will allow you to select one of the controllers by clicking on it. There is a search field provided so that you can find your controller quickly. Once selected all subsequent commands will only be sent to the selected controller.
- Search - BluBØX provides a search field to quickly narrow the selection of controllers.
- Online Only - When checked this will only allow online controllers to show up. If the controller is not yet in BluSKY and is not online, it will not show up.
- Select a Controller - This section is where you can select a controller to perform one of the many diagnostic functions. All options on this screen are scoped to the selected controller.

Control Point Diagnostics
Every Control Point that is defined for a System will be displayed to the right of the Controller selection pane. By selecting the Control Point you will be able to use the buttons to either:
- Control Point Status - This option will display the Control Points current status in the "Replies from Controller" section above.
- Control Point On - This option will turn the Control Point on until another event overrides the current action.
- Control Point Off - Turning the Control Point off will instantly override any command and turn the Control Point off.
- Single Cycle - This will activate the Control Point for a single cycle. The cycle is defined in the Control Point configuration.

Monitoring Point Diagnostics
Testing the Monitoring Points is perhaps the easiest thing to test from this diagnostic page. Simply select the Monitoring Point you wish to test by clicking on it and then clicking the button. Once clicked the status will appear in the Replies from Controller text area above.
